LC-MS/MS Plasma Quantification: A Complete Guide to Sensitive, Reliable Bioanalysis from Sample to Data
This comprehensive guide details the core principles and advanced applications of LC-MS/MS for quantifying drugs and metabolites in plasma.
LC-MS/MS Plasma Quantification: A Complete Guide to Sensitive, Reliable Bioanalysis from Sample to Data
Abstract
This comprehensive guide details the core principles and advanced applications of LC-MS/MS for quantifying drugs and metabolites in plasma. Designed for bioanalytical scientists and researchers, it systematically covers the foundational technology, method development workflow, common troubleshooting strategies, and the rigorous validation required for clinical and preclinical studies. The article provides actionable insights into achieving sensitivity, specificity, and robustness in regulated bioanalysis, ensuring reliable pharmacokinetic and toxicokinetic data.
Understanding the Core: Why LC-MS/MS is the Gold Standard for Plasma Drug Analysis
In the pursuit of accurate drug quantification for pharmacokinetic, toxicokinetic, and therapeutic drug monitoring studies, liquid chromatography coupled with tandem mass spectrometry (LC-MS/MS) has emerged as the gold standard. Plasma, the liquid component of blood, is the predominant biological matrix for such analyses. It provides a direct reflection of systemic drug exposure. However, its inherent biochemical complexity presents a formidable analytical challenge. This whitepaper, framed within the context of fundamental research on LC-MS/MS plasma drug quantification, deconstructs the core challenges and details the advanced methodologies required to overcome them.
The Multifaceted Complexity of Plasma
The analytical interference of plasma stems from its diverse composition of proteins, lipids, salts, and endogenous metabolites, which coexist with the target analyte (often at trace levels).
Table 1: Major Interfering Components in Human Plasma and Their Impact on LC-MS/MS Analysis
| Component Class | Example Constituents | Concentration Range | Primary Interference Mechanism |
|---|---|---|---|
| Proteins | Albumin, Immunoglobulins, Fibrinogen | 60-80 g/L | Matrix effect (ion suppression), column fouling, non-specific binding. |
| Lipids | Phospholipids (e.g., PC, LPC, PE), Triglycerides, Cholesterol Esters | 1.5-3.0 g/L (Phospholipids: ~1-2 mM) | Severe ion suppression, especially in ESI+, source contamination, isobaric interference. |
| Salts & Electrolytes | Na⁺, K⁺, Cl⁻, Ca²⁺ | ~150 mM (Na⁺) | Source contamination, adduct formation ([M+Na]⁺, [M+K]⁺), signal instability. |
| Endogenous Metabolites | Amino acids, Bile acids, Urea, Glucose | Variable (µM to mM) | Chromatographic co-elution, isobaric or isomeric interference. |
| Exogenous Compounds | Diet-derived molecules, concomitant medications | Highly Variable | Direct isobaric interference, altered metabolism, additive matrix effects. |
Core Challenge 1: The Matrix Effect
Matrix effect (ME) is the alteration of ionization efficiency of an analyte due to co-eluting components from the sample matrix. It is the most significant contributor to quantitative inaccuracy in LC-MS/MS.
Experimental Protocol for Matrix Effect Assessment (Post-extraction Addition Method):
- Prepare Matrix-free Samples: Spike the analyte of interest at Low, Medium, and High QC concentrations into reconstitution solvent (neat solutions).
- Prepare Post-extraction Spiked Samples: Process multiple lots of blank plasma (ideally ≥6 from individual donors) through the entire sample preparation workflow. After evaporation and reconstitution, spike the same analyte concentrations into the extracted matrix.
- Prepare Pre-extraction Spiked Samples: Spike analyte into blank plasma and process through the full method to assess overall process efficiency.
- LC-MS/MS Analysis: Analyze all sample sets.
- Calculation:
- Matrix Factor (MF) = Peak area (Post-extraction spike) / Peak area (Matrix-free spike).
- % Matrix Effect = (MF - 1) * 100%. An MF of 1 (0% ME) indicates no effect. <1 indicates suppression; >1 indicates enhancement.
- Internal Standard Normalized MF = MF(analyte) / MF(IS). The CV% of the normalized MF across different plasma lots should be <15%.
Core Challenge 2: Phospholipid Interference
Phospholipids (PLs) are a major subset of lipids causing persistent ion suppression, particularly in positive electrospray ionization (ESI+). They elute in characteristic regions based on their polarity (e.g., lysophosphatidylcholines early, phosphatidylcholines later).
Detailed Protocol for Phospholipid Monitoring and Removal:
- Monitoring: Inject a processed blank plasma sample and monitor characteristic positive ion MRM transitions: m/z 184→184 for phosphatidylcholine (PC) and lysophosphatidylcholine (LPC) class, and m/z 104→104 for phosphatidylethanolamine (PE) class. This identifies "hot zones" of phospholipid elution.
- Removal via HybridSPE-Phospholipid or Similar Sorbents:
- Conditioning: Add 200 µL of methanol to the well/cartridge.
- Sample Application: Apply 100 µL of plasma (precipitated with 300 µL of acetonitrile containing 1% formic acid) to the sorbent.
- Washing: Apply a vacuum to pass the sample through. Phospholipids are retained via zirconia-coated silica mechanisms.
- Elution: Collect the eluent (the filtrate), which contains the small molecule analytes, for evaporation and LC-MS/MS analysis.
Experimental Workflow for Robust Plasma Bioanalysis
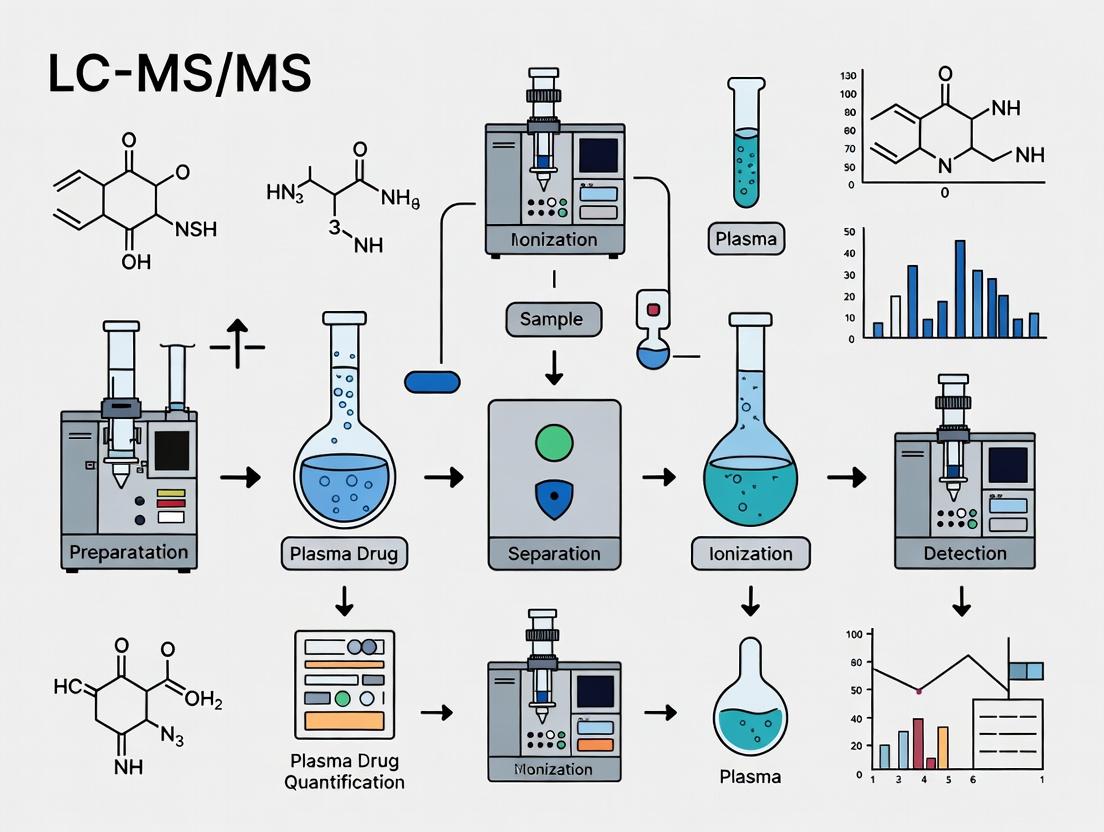
The following diagram outlines a comprehensive strategy to manage plasma complexity.
Diagram 1: Integrated Workflow to Mitigate Plasma Complexity
The Scientist's Toolkit: Key Research Reagent Solutions
Table 2: Essential Materials for Advanced Plasma Bioanalysis
| Item | Function & Rationale |
|---|---|
| Stable Isotope-Labeled Internal Standard (SIL-IS) | Gold standard for correcting for losses during sample prep and matrix effects during ionization. Its chemical identity is identical to the analyte except for mass. |
| HybridSPE-Phospholipid (or equivalent) 96-well plates | Zirconia-coated silica sorbent for selective removal of phospholipids from protein-precipitated samples, dramatically reducing ion suppression. |
| Diversified Blank Plasma Lots (Individual donor, K2/K3 EDTA) | Essential for method development and validation to assess matrix effect variability, selectivity, and accuracy across a representative population. |
| Selective SPE Sorbents (Mixed-mode Cation/Anion Exchange, HLB) | Provide superior cleanup versus protein precipitation alone by leveraging multiple interaction modes (reverse phase, ion exchange). |
| LC Columns with Advanced Bonding (e.g., Charged Surface Hybrid, PFP, HILIC) | Offer alternative selectivity to standard C18 columns, helping to separate analytes from co-eluting matrix interferents. |
| Phospholipid MRM Kit/Solution | Pre-defined MRM transitions for monitoring major phospholipid classes to visually map and avoid their elution during method development. |
Plasma remains an irreplaceable yet profoundly complex matrix for quantitative LC-MS/MS bioanalysis. The core challenges—matrix effects, phospholipid interference, and endogenous/exogenous interferences—are interconnected and must be addressed systematically. Success hinges on a holistic strategy combining the mandatory use of a SIL-IS, a sample preparation technique chosen for both recovery and selectivity (often incorporating dedicated phospholipid removal), and chromatographic conditions optimized to separate the analyte from residual matrix components. Continuous assessment via standardized experiments, such as post-column infusion and post-extraction spike evaluations, is fundamental. Mastering this complexity is not merely a technical exercise but a critical foundation for generating reliable data that underpins drug development and patient care decisions.
In the critical field of plasma drug quantification for pharmacokinetic and toxicology studies, Liquid Chromatography (LC) coupled with tandem mass spectrometry (MS/MS) stands as the undisputed gold standard. This in-depth guide explores the synergistic power of this tandem technique, framed within fundamental research for robust and sensitive bioanalytical method development.
Core Principle: A Synergistic Workflow
The fundamental power lies in combining two high-resolution techniques: LC for physical separation and MS/MS for highly specific and sensitive detection. This tandem approach overcomes the limitations of each standalone method when dealing with complex biological matrices like plasma.
Liquid Chromatography: The Separation Engine
LC separates the analyte of interest from the myriad of endogenous compounds in plasma (proteins, lipids, salts, metabolites). A reversed-phase C18 column is most common.
Key Protocol: Sample Preparation for Plasma
- Protein Precipitation: A 50 µL plasma aliquot is mixed with 150 µL of cold acetonitrile (containing internal standard). Vortex for 1 minute, then centrifuge at 13,000 x g for 10 minutes at 4°C.
- Supernatant Transfer: The clear supernatant (≈150 µL) is transferred to a clean LC vial with insert. A typical injection volume is 5-10 µL.
- Chromatographic Conditions:
- Mobile Phase A: 0.1% Formic acid in water.
- Mobile Phase B: 0.1% Formic acid in acetonitrile.
- Gradient: 5% B to 95% B over 3.5 minutes.
- Flow Rate: 0.4 mL/min.
- Column Temperature: 40°C.
Tandem Mass Spectrometry: The Detection Powerhouse
MS/MS provides specificity by isolating the target ion (precursor), fragmenting it, and detecting characteristic product ions.
Key Protocol: MRM Method Development
- Infusion & Precursor Ion Scan: The pure standard is directly infused into the MS to identify the intact molecular ion ([M+H]+ or [M-H]-).
- Product Ion Scan: The selected precursor ion is fragmented in the collision cell (using Collision Energy, CE, typically 10-40 eV). A scan reveals characteristic product ions.
- MRM Transition Selection: The 2-3 most intense and specific product ions are chosen. The most intense is the quantifier, the others are qualifiers.
- Optimization: Declustering Potential (DP) and Collision Energy (CE) are optimized for each transition.
Table 1: Typical Performance Metrics for a Validated LC-MS/MS Plasma Assay
| Parameter | Target Value | Example Data (Hypothetical Drug X) |
|---|---|---|
| Linear Range | ≥2 orders of magnitude | 1.0 - 500 ng/mL |
| Accuracy (%) | 85-115% (LLOQ: 80-120%) | 94.2 - 105.7% |
| Precision (%CV) | ≤15% (LLOQ: ≤20%) | 3.1 - 8.5% |
| Lower Limit of Quantification (LLOQ) | Signal-to-Noise ≥5 | 1.0 ng/mL (S/N=12) |
| Matrix Effect (%) | 85-115% | 92% (Ion Suppression: 8%) |
| Recovery (%) | Consistent & ≥50% | 85% |
Table 2: Comparison of MS/MS Scan Modes
| Scan Mode | Precursor Ion Selection | Product Ion Detection | Primary Use in Quantification |
|---|---|---|---|
| Selected Reaction Monitoring (SRM/MRM) | Fixed (Single m/z) | Fixed (Single m/z) | High-sensitivity targeted quantification. |
| Product Ion Scan | Fixed (Single m/z) | Full Scan (Range of m/z) | Method development, fragmentation study. |
| Precursor Ion Scan | Full Scan (Range of m/z) | Fixed (Single m/z) | Identifying all precursors yielding a common fragment. |
Visualization of Core Concepts
Diagram 1: Simplified LC-MS/MS Workflow Path
Diagram 2: Two Dimensions of Specificity
The Scientist's Toolkit: Essential Research Reagent Solutions
Table 3: Key Materials for LC-MS/MS Plasma Quantification
| Item | Function & Rationale |
|---|---|
| Stable Isotope-Labeled Internal Standard (SIL-IS) | Corrects for variability in sample prep, ionization efficiency, and matrix effects. The chemically identical form with heavy isotopes (e.g., ^13C, ^15N, ^2H) co-elutes but is distinguished by MS. |
| Mass Spectrometry-Grade Solvents (ACN, MeOH, Water) | Ultra-purity minimizes background ions, reduces system contamination, and ensures reproducible chromatography and ionization. |
| Ammonium Formate/Acetate & Formic/Acetic Acid | Common volatile buffers and pH modifiers for mobile phases. They aid in separation and promote efficient ionization in ESI (positive or negative mode) without leaving residues. |
| Blank Matrix (Plasma) | Typically human or species-specific control plasma. Essential for preparing calibration standards and quality control samples to match the matrix of study samples. |
| Solid-Phase Extraction (SPE) Plates/Cartridges | For advanced sample cleanup, offering selective extraction and concentration of analytes, leading to lower matrix effects and improved sensitivity over protein precipitation. |
| LC Column (e.g., C18, 2.1 x 50 mm, 1.7-2.6 µm) | The core separation component. Small particle sizes provide high efficiency and peak capacity for resolving analytes from interferences in short run times. |
This technical guide details the core components of Liquid Chromatography-Tandem Mass Spectrometry (LC-MS/MS) within the context of fundamental research on plasma drug quantification. The precision and sensitivity of this technique make it the gold standard for pharmacokinetic studies and therapeutic drug monitoring in drug development.
High-Performance Liquid Chromatography (HPLC)
The HPLC system is responsible for the initial separation of the complex biological matrix, isolating the analyte of interest from endogenous plasma components. This reduces ion suppression and matrix effects in the mass spectrometer.
Key Experimental Protocol: Method Development for Plasma Drug Analysis
- Sample Preparation: Thaw plasma samples on ice. Precipitate proteins using a 3:1 ratio of organic solvent (e.g., acetonitrile with 0.1% formic acid) to plasma. Vortex for 1 minute and centrifuge at 14,000 x g for 10 minutes at 4°C. Transfer the supernatant to an HPLC vial.
- Column Selection: Use a reverse-phase C18 column (e.g., 2.1 x 50 mm, 1.7-1.8 μm particle size) for most small-molecule drugs.
- Mobile Phase: Mobile Phase A: Water with 0.1% Formic Acid. Mobile Phase B: Acetonitrile with 0.1% Formic Acid.
- Gradient Elution: A typical 5-minute gradient is optimized as follows (Table 1). The flow rate is maintained at 0.4 mL/min, and the column oven at 40°C.
- Injection Volume: Typically 2-10 μL of processed sample.
Table 1: Optimized HPLC Gradient for Rapid Plasma Analysis
| Time (min) | % Mobile Phase A | % Mobile Phase B | Function |
|---|---|---|---|
| 0.0 | 95 | 5 | Equilibration |
| 0.5 | 95 | 5 | Hold |
| 3.0 | 5 | 95 | Linear Gradient |
| 3.5 | 5 | 95 | Wash |
| 3.6 | 95 | 5 | Switch |
| 5.0 | 95 | 5 | Re-equilibration |
Diagram: LC-MS/MS Workflow for Plasma Drug Quantification
The ion source converts eluting analytes from the liquid phase into gas-phase ions. The two most common sources for plasma drug analysis are Electrospray Ionization (ESI) and Atmospheric Pressure Chemical Ionization (APCI).
Table 2: Comparison of Common LC-MS/MS Ion Sources
| Feature | Electrospray Ionization (ESI) | Atmospheric Pressure Chemical Ionization (APCI) |
|---|---|---|
| Mechanism | Charged droplet evaporation via high voltage | Nebulization + gas-phase chemical ionization by corona discharge |
| Ideal For | Polar, ionic, and thermally labile molecules (e.g., metabolites, peptides). | Less polar, low-to-medium molecular weight compounds (e.g., steroids, lipids). |
| Adduct Formation | Prone to [M+H]⁺, [M+Na]⁺, [M-H]⁻ | Primarily [M+H]⁺ or [M-H]⁻ |
| Flow Rate Range | Optimal at < 1 mL/min (nano to micro-flow) | Tolerates higher flow rates (up to 2 mL/min) |
| Susceptibility to Matrix Effects | High (co-eluting salts can suppress ionization) | Moderate (less affected by salts) |
Experimental Protocol: Ion Source Optimization
- Source Temperature: Typically 300-500°C for desolvation.
- Nebulizer Gas Pressure: Set between 30-50 psi (Nitrogen or Air).
- Drying Gas Flow: Set between 8-12 L/min (Nitrogen).
- Capillary Voltage: Optimize between 2.5-4.5 kV for ESI in positive mode.
- Corona Current: For APCI, optimize between 2-10 μA.
- Tuning: Continuously infuse a standard solution of the target analyte (e.g., 100 ng/mL in mobile phase) via a syringe pump. Adjust parameters to maximize the precursor ion signal intensity.
Triple Quadrupole Mass Analyzer
The triple quadrupole (QqQ) mass spectrometer is the cornerstone of quantitative LC-MS/MS due to its exceptional selectivity and sensitivity in Selected Reaction Monitoring (SRM) or Multiple Reaction Monitoring (MRM) mode.
Diagram: Triple Quadrupole MRM Scanning Logic
Key Experimental Protocol: MRM Method Development
- Precursor Ion Selection: Directly infuse the pure analyte. Perform a Q1 scan to identify the dominant precursor ion (e.g., [M+H]⁺).
- Product Ion Selection: Introduce the selected precursor into q2. Apply a low collision energy (e.g., 5-10 eV) and perform a product ion scan in Q3. Identify 2-3 abundant, characteristic product ions.
- Optimization: For each precursor-product ion pair (transition), optimize collision energy (typically 15-40 eV) and declustering potential to maximize signal.
- Method Setup: Assign the most intense transition as the "quantifier" and the second as the "qualifier." Set dwell times (typically 10-100 ms) to ensure sufficient data points across the chromatographic peak.
Table 3: Example MRM Parameters for a Model Drug and its Internal Standard (IS)
| Compound | Precursor Ion (m/z) | Product Ion (m/z) | Collision Energy (eV) | Declustering Potential (V) | Function |
|---|---|---|---|---|---|
| Drug X | 309.1 | 154.9* | 28 | 80 | Quantifier |
| Drug X | 309.1 | 112.0 | 35 | 80 | Qualifier |
| Drug X-d₆ (IS) | 315.1 | 158.9 | 28 | 80 | Quantifier |
*Primary transition used for quantification.
The Scientist's Toolkit: Key Research Reagent Solutions
Table 4: Essential Materials for LC-MS/MS Plasma Drug Quantification
| Item | Function in Research |
|---|---|
| Stable Isotope-Labeled Internal Standards (e.g., ¹³C, ²H) | Corrects for variability in sample preparation, ionization efficiency, and matrix effects; essential for accurate quantification. |
| Mass Spectrometry-Grade Solvents (Acetonitrile, Methanol, Water) | Minimize chemical noise and background ions, ensuring high signal-to-noise ratio and system longevity. |
| High-Purity Formic Acid or Ammonium Acetate/Formate | Provides volatile acid or buffer for mobile phase to facilitate protonation/deprotonation and improve chromatographic peak shape. |
| Blank Matrix (Drug-Free Human Plasma) | Used for preparing calibration standards and quality control samples to match the sample matrix and validate method specificity. |
| Protein Precipitation Plates (96-well) / Solid Phase Extraction (SPE) Cartridges | Enable high-throughput sample cleanup, removing proteins and phospholipids that cause ion suppression. |
| Quality Control (QC) Materials at Low, Mid, High Concentrations | Monitor the precision, accuracy, and stability of the analytical run over time. |
Within the foundational research of LC-MS/MS plasma drug quantification, establishing robust method performance is paramount. Three interlinked yet distinct metrics—Sensitivity (as defined by the Lower Limit of Quantification, LLOQ), Selectivity, and Specificity—form the cornerstone of assay validation. This technical guide delineates these concepts, providing experimental frameworks for their determination, framed within the context of bioanalytical method development for regulated drug development.
Defining the Core Metrics
Sensitivity (LLOQ): The lowest concentration of an analyte in a sample that can be quantitatively determined with suitable precision (typically ≤20% CV) and accuracy (typically 80-120%). The LLOQ is a definitive measure of assay sensitivity and is critical for characterizing pharmacokinetic profiles, especially during the elimination phase.
Selectivity: The ability of the analytical method to differentiate and quantify the analyte in the presence of other components in the sample matrix, such as endogenous compounds, metabolites, or concomitant medications. It is assessed by analyzing blank matrix from multiple sources.
Specificity: A more stringent aspect of selectivity, referring to the ability to assess unequivocally the analyte in the presence of components that might be expected to be present, such as structurally similar isomers, degradants, or co-administered drugs. Specificity challenges the method with known potential interferents.
Table 1: Typical Acceptance Criteria for Key Performance Metrics
| Metric | Experimental Test | Acceptance Criteria | Regulatory Guidance Reference (e.g., FDA, EMA) |
|---|---|---|---|
| Sensitivity (LLOQ) | Analysis of ≥5 replicates at LLOQ concentration. | Accuracy: 80-120%Precision: ≤20% CVSignal-to-Noise (S/N): Typically ≥5 | FDA Bioanalytical Method Validation (2018) |
| Selectivity | Analysis of blank plasma from at least 6 individual sources. | Analyte response in blanks < 20% of LLOQ response.IS response < 5% of mean IS response in spiked samples. | EMA Guideline on Bioanalytical Method Validation (2011) |
| Specificity | Analysis of LLOQ samples spiked with potential interferents (metabolites, isomers, common medications). | Accuracy of analyte: 80-120% at LLOQ.No co-elution or signal contribution from interferent. | ICH M10 on Bioanalytical Method Validation (2022) |
Table 2: Example LLOQ Determination Data for a Hypothetical Drug X
| Nominal Conc. (pg/mL) | Mean Measured Conc. (pg/mL) | Accuracy (%) | Precision (%CV) | S/N Ratio | Meets LLOQ Criteria? |
|---|---|---|---|---|---|
| 1.0 (Proposed LLOQ) | 0.98 | 98.0 | 8.5 | 12.3 | Yes |
| 0.5 | 0.42 | 84.0 | 22.1 | 3.1 | No (Precision >20%) |
Detailed Experimental Protocols
Protocol 1: Determination of LLOQ and Sensitivity
- Preparation: Prepare a calibration standard at the proposed LLOQ concentration (e.g., 1-5% of expected Cmax) from an independent weighing of reference standard. Dilute in appropriate biological matrix (e.g., human plasma).
- Sample Processing: Process a minimum of five (recommended six) replicate samples of the LLOQ concentration through the entire sample preparation procedure (e.g., protein precipitation, liquid-liquid extraction, solid-phase extraction).
- Instrumental Analysis: Analyze replicates via the LC-MS/MS method. The chromatographic run time must be sufficient for baseline resolution.
- Data Analysis: Calculate the mean concentration, accuracy (% of nominal), and precision (% coefficient of variation, CV). The signal-to-noise ratio (S/N) is calculated from the analyte peak in the LLOQ sample versus a blank sample.
- Acceptance: The LLOQ is accepted if all replicates meet the predefined criteria for accuracy (80-120%) and precision (≤20% CV).
Protocol 2: Assessment of Selectivity
- Matrix Sampling: Obtain blank matrix (e.g., K2EDTA plasma) from at least six individual sources. Include sources with potential pathologies (e.g., hemolyzed, lipemic, hyperbilirubinemic) if relevant.
- Analysis: Process and analyze each blank sample without the analyte but with the internal standard (IS). Also, analyze a blank sample without IS.
- Evaluation: Inspect chromatograms at the retention times of the analyte and IS. The response in the blank at the analyte's retention time should be <20% of the mean LLOQ response. The response in the blank at the IS retention time should be <5% of the mean IS response in spiked samples.
Protocol 3: Challenge of Specificity
- Interferent Selection: Identify structurally related compounds (isomers, metabolites) and potentially co-administered drugs.
- Sample Preparation: Prepare solutions containing the interferent at a high, physiologically relevant concentration. Prepare LLOQ samples spiked with these interferents.
- Analysis: Analyze the interferent-only samples and the challenged LLOQ samples.
- Evaluation: Verify that the interferent does not co-elute with the analyte or IS, and that the quantitation of the analyte in the challenged LLOQ sample meets accuracy criteria (80-120%).
Visualizations
Diagram 1: Interrelationship of Key Metrics in Method Validation
Diagram 2: Experimental Workflow for Selectivity Assessment
The Scientist's Toolkit: Research Reagent Solutions
Table 3: Essential Materials for LC-MS/MS Plasma Assay Validation
| Item | Function & Specification | Criticality |
|---|---|---|
| Certified Reference Standard | High-purity analyte for preparing calibration standards. Must have certificate of analysis (CoA) defining purity and storage conditions. | High |
| Stable Isotope-Labeled Internal Standard (SIL-IS) | Isotopically labeled version of the analyte (e.g., ²H, ¹³C, ¹⁵N). Corrects for matrix effects and variability in extraction/ionization. | High |
| Control Matrix (e.g., Human Plasma) | Blank biological matrix from appropriate species (K2EDTA, heparin). Should be screened for absence of analyte. Pooled from multiple donors. | High |
| Potential Interferents | Reference standards of major metabolites, isomers, and commonly co-administered drugs to challenge assay specificity. | Medium |
| LC-MS/MS Grade Solvents | Acetonitrile, methanol, water, and formic/acidic acid with minimal ion suppression/enhancement and background interference. | High |
| Solid-Phase Extraction (SPE) Cartridges or Plates | For selective sample cleanup. Chemistry (C18, mixed-mode) must be optimized for analyte and matrix. | Medium/High |
| Mass Tune/Calibration Solution | Vendor-specific solution containing known masses for calibrating the mass analyzer (Q1 and Q3) to ensure accurate mass assignment. | High |
Within the framework of advancing LC-MS/MS plasma drug quantification fundamentals, this whitepaper explores four pivotal applications that underpin modern pharmaceutical development. The unparalleled sensitivity, specificity, and throughput of LC-MS/MS have made it the cornerstone technology for generating robust quantitative data to inform critical decisions from discovery through clinical care.
Pharmacokinetics/Pharmacodynamics (PK/PD)
PK/PD modeling quantitatively links drug exposure (pharmacokinetics) to its pharmacological effect (pharmacodynamics). LC-MS/MS plasma concentration data is the fundamental input for PK modeling, enabling the derivation of parameters such as AUC, C~max~, T~max~, and half-life (t~1/2~).
Core Experimental Protocol for PK Study Sample Analysis via LC-MS/MS:
- Sample Collection: Serial blood draws from preclinical (rodent, canine, primate) or clinical subjects at predetermined time points post-dose.
- Sample Preparation: Plasma harvested via centrifugation. An internal standard (stable isotope-labeled analog of the analyte) is added to an aliquot (e.g., 50 µL). Proteins are precipitated using organic solvents (e.g., 200 µL acetonitrile or methanol), vortexed, and centrifuged. The supernatant is diluted with water or mobile phase and injected.
- LC-MS/MS Analysis:
- Chromatography: Reverse-phase C18 column (e.g., 2.1 x 50 mm, 1.7-2.7 µm). Gradient elution from aqueous (0.1% Formic Acid) to organic (Acetonitrile) mobile phase.
- Mass Spectrometry: Positive/negative ESI mode. Two MRM transitions per analyte (quantifier and qualifier) are monitored. A calibration curve (1-1000 ng/mL) and quality control samples are run concurrently.
- Data Analysis: Concentrations are calculated from the calibration curve using the analyte-to-internal standard response ratio. PK parameters are derived via non-compartmental analysis (NCA) using software like Phoenix WinNonlin.
Diagram 1: PK/PD Modeling Feedback Loop
Bioavailability/Bioequivalence (BA/BE)
BA measures the rate and extent of drug absorption. BE demonstrates that the bioavailability of a test formulation (e.g., generic) is not significantly different from a reference formulation (e.g., innovator). LC-MS/MS provides the precise, accurate, and reproducible concentration data required by regulatory agencies (FDA, EMA).
Standard Two-Period Crossover BE Study Protocol:
- Study Design: Randomized, two-period, two-sequence, single-dose crossover in healthy volunteers (n=24-36), with a washout period ≥5x the drug's half-life.
- Sample Analysis: Plasma samples from each period are analyzed for parent drug (and sometimes major active metabolite) using a validated LC-MS/MS method per FDA/ICH guidelines.
- Statistical Evaluation: AUC~0-t~, AUC~0-∞~, and C~max~ are log-transformed. The 90% confidence interval for the geometric mean ratio (Test/Reference) must fall within 80.00%-125.00% to demonstrate BE.
Table 1: Key BE Statistical Acceptance Criteria
| PK Parameter | Comparison Basis | Acceptance Criteria (90% CI) |
|---|---|---|
| AUC~0-t~ (Extent) | Geometric Mean Ratio (Test/Ref) | 80.00% – 125.00% |
| AUC~0-∞~ (Extent) | Geometric Mean Ratio (Test/Ref) | 80.00% – 125.00% |
| C~max~ (Rate) | Geometric Mean Ratio (Test/Ref) | 80.00% – 125.00% |
Metabolite Identification (Metabolite ID)
Identifying and characterizing drug metabolites is critical for understanding metabolic clearance, bioactivation, and potential safety risks. High-resolution LC-MS/MS (HRMS) is the primary tool for this application.
Typical In Vitro Metabolite ID Workflow:
- Incubation: Drug (1-10 µM) incubated with liver microsomes, hepatocytes, or recombinant enzymes in appropriate buffer (e.g., PBS) with cofactors (e.g., NADPH). Reaction is quenched with cold acetonitrile.
- LC-HRMS Analysis:
- Chromatography: Longer, high-efficiency C18 column for separation.
- Mass Spectrometry: Q-TOF or Orbitrap instrument. Data acquired in full-scan and data-dependent MS/MS (dd-MS2) modes.
- Data Processing: Post-acquisition software (e.g., Compound Discoverer, MetabolitePilot) compares samples to controls, lists potential metabolites based on accurate mass shifts (e.g., +15.995 Da for oxidation), and interprets MS/MS fragments to propose structures.
Diagram 2: Metabolite ID LC-HRMS Workflow
Therapeutic Drug Monitoring (TDM)
TDM uses measured drug concentrations in individual patients to tailor dosing regimens, optimizing efficacy and minimizing toxicity for drugs with a narrow therapeutic index.
Validated Clinical LC-MS/MS Assay Protocol:
- Sample: Trough plasma/serum sample collected at steady-state.
- Sample Prep: Often uses solid-phase extraction (SPE) or more advanced techniques like supported liquid extraction (SLE) for superior cleanliness and sensitivity.
- LC-MS/MS Analysis: Uses a highly robust, selective, and often multiplexed MRM method. Validation includes precision (<15% CV), accuracy (85-115%), and demonstration of no interference from common concomitant medications.
- Reporting: Concentration is reported with a therapeutic range. Clinical pharmacologists interpret the result in the context of the patient's clinical status.
Table 2: Example Drugs Requiring TDM
| Drug Class | Example Drug | Therapeutic Range | Primary Indication |
|---|---|---|---|
| Immunosuppressant | Tacrolimus | 5-15 ng/mL | Organ Transplantation |
| Antiepileptic | Carbamazepine | 4-12 µg/mL | Seizure Disorders |
| Antibiotic | Vancomycin | Trough: 10-20 µg/mL | Serious Gram-positive Infections |
| Antipsychotic | Clozapine | 350-600 ng/mL | Treatment-Resistant Schizophrenia |
The Scientist's Toolkit: LC-MS/MS Plasma Quantification Essentials
Table 3: Key Research Reagent Solutions & Materials
| Item | Function/Description |
|---|---|
| Stable Isotope-Labeled Internal Standard (IS) | Corrects for variability in sample prep and ionization; e.g., Deuterated ([²H]) or ¹³C-labeled analog of the analyte. |
| Mass Spectrometry-Grade Solvents | Acetonitrile, Methanol, Water (with 0.1% Formic Acid or Ammonium Acetate). Minimizes background ions and ensures reproducibility. |
| Protein Precipitation Plates (96-well) | High-throughput format for simultaneous processing of calibration standards, QCs, and study samples. |
| Solid Phase Extraction (SPE) Cartridges | For cleaner extracts in TDM or low-concentration analytes. Options include mixed-mode cation/anion exchange. |
| Pooled Human/Animal Plasma | Matrix for preparing calibration standards and quality control (QC) samples to match the study samples. |
| LC Column: C18, 2.1 x 50 mm, <3 µm | Standard reverse-phase column for fast, high-resolution separation of small molecule drugs and metabolites. |
| Quality Control (QC) Samples | Prepared at low, mid, and high concentrations in plasma; used to monitor assay accuracy and precision throughout batch runs. |
From Theory to Bench: A Step-by-Step Guide to LC-MS/MS Method Development
In LC-MS/MS quantification of drugs in plasma, sample preparation is the critical first step that dictates the success of the entire analytical workflow. This guide details three core techniques—Protein Precipitation (PPT), Liquid-Liquid Extraction (LLE), and Solid-Phase Extraction (SPE)—within the framework of a thesis dedicated to the fundamentals of precise and reproducible plasma drug quantification.
The selection of a sample preparation method involves trade-offs between recovery, cleanliness, and throughput.
Table 1: Quantitative Comparison of PPT, LLE, and SPE
| Parameter | Protein Precipitation (PPT) | Liquid-Liquid Extraction (LLE) | Solid-Phase Extraction (SPE) |
|---|---|---|---|
| Typical Recovery (%) | 70-90 (analyte-dependent) | 70-95 | 85-100 |
| Clean-up Efficiency | Low | Medium-High | High |
| Ion Suppression Risk | High | Medium | Low |
| Sample Volume (µL) | 50-200 | 100-1000 | 50-500 |
| Organic Solvent Use | High (dilution) | Medium | Low-Modernate |
| Throughput Potential | Very High | Medium | Medium (can be automated) |
| Relative Cost | Low | Low | High |
| Best For | High-throughput screening | Non-polar to semi-polar analytes | Complex matrices, polar analytes |
Detailed Methodologies and Protocols
Protein Precipitation (PPT)
Principle: Disruption of protein structure using organic solvents or acids, followed by centrifugation to pellet proteins.
Protocol: Acetonitrile Precipitation for Small Molecules
- Aliquoting: Pipette 100 µL of plasma (calibrators, QCs, study samples) into a microcentrifuge tube.
- Precipitation: Add 300 µL of ice-cold acetonitrile (containing internal standard) to each tube.
- Vortex & Incubate: Vortex mix vigorously for 60 seconds. Incubate at -20°C for 10 minutes to enhance protein pelleting.
- Centrifugation: Centrifuge at 14,000 x g for 10 minutes at 4°C.
- Collection: Transfer 200-250 µL of the clear supernatant to a clean vial or 96-well plate.
- Evaporation & Reconstitution (Optional): Evaporate to dryness under a gentle stream of nitrogen at 40°C. Reconstitute in 100 µL of initial LC mobile phase (e.g., 5% acetonitrile in water) and vortex.
Liquid-Liquid Extraction (LLE)
Principle: Partitioning of analytes between immiscible organic and aqueous (plasma) phases based on solubility.
Protocol: Tert-Butyl Methyl Ether (TBME) Extraction for Basic Drugs
- Aliquoting: Pipette 200 µL of plasma into a glass tube.
- Conditioning: Add 25 µL of 10% ammonium hydroxide to basify the sample (target pH ~9-10).
- Extraction: Add 1.5 mL of TBME. Cap and shake mechanically for 15 minutes.
- Phase Separation: Centrifuge at 3,000 x g for 5 minutes to separate layers.
- Transfer: Transfer the upper (organic) layer to a clean tube.
- Evaporation: Evaporate the organic layer to dryness under nitrogen at 40°C.
- Reconstitution: Reconstitute the dry extract in 150 µL of a compatible LC solvent (e.g., 50:50 methanol:water), vortex, and centrifuge before injection.
Solid-Phase Extraction (SPE)
Principle: Selective retention and elution of analytes from a solid sorbent based on specific chemical interactions.
Protocol: Mixed-Mode Cation Exchange (MCX) SPE for Basic Analytes
- Sorbent Conditioning: Condition a 30 mg MCX cartridge with 1 mL of methanol, followed by 1 mL of water. Do not let the sorbent dry.
- Sample Loading: Acidify 200 µL of plasma with 200 µL of 2% formic acid in water. Load the mixture onto the cartridge at a slow, dropwise rate (~1 drop/second).
- Washing: Wash sequentially with 1 mL of 2% formic acid in water, followed by 1 mL of methanol. This removes proteins, salts, and neutral interferences.
- Drying: Apply full vacuum for 5 minutes to dry the sorbent completely.
- Elution: Elute analytes with 1 mL of a freshly prepared elution solvent (5% ammonium hydroxide in methanol).
- Evaporation & Reconstitution: Evaporate the eluate to dryness under nitrogen at 40°C. Reconstitute in 200 µL of initial mobile phase, vortex, and centrifuge.
Visualizing the Sample Preparation Decision Workflow
Sample Prep Method Selection Flow
The Scientist's Toolkit: Essential Research Reagents & Materials
Table 2: Key Reagents and Consumables for Plasma Sample Prep
| Item | Primary Function | Example(s) |
|---|---|---|
| Internal Standard (IS) | Corrects for variability in extraction efficiency, evaporation, and matrix effects. | Stable-isotope labeled analog of the analyte (d3-, 13C-); structural analog. |
| Protein Precipitant | Denatures and precipitates plasma proteins to release analytes. | Acetonitrile, Methanol, Trichloroacetic Acid. |
| LLE Extraction Solvent | Immiscible organic solvent for selective partitioning of the analyte. | Tert-Butyl Methyl Ether (TBME), Ethyl Acetate, Hexane, Methyl tert-Butyl Ether. |
| pH Adjustor (LLE/SPE) | Modifies analyte ionization state to favor transfer to organic phase or sorbent. | Ammonium Hydroxide (for basic analytes), Formic Acid/Acetic Acid (for acidic analytes). |
| SPE Cartridge/Sorbent | Selectively binds analytes based on chemical interaction for clean-up. | Reversed-Phase (C18), Mixed-Mode (MCX for cations, MAX for anions), Polymer-based. |
| SPE Wash/Elution Solvents | Remove interferences (wash) and recover purified analytes (elution). | Water, Acidified Water, Methanol, Acetonitrile, Ammoniated/ Acidified Organic Solvents. |
| Evaporation System | Gently removes extraction solvents for analyte reconstitution in MS-compatible buffer. | Nitrogen Evaporator (with heated block or bath). |
| Low-Binding Microtubes/Plates | Minimizes nonspecific adsorption of analyte, especially critical for low-abundance compounds. | Polypropylene tubes/plates, silanized glass inserts. |
Within the framework of foundational LC-MS/MS research for plasma drug quantification, chromatography optimization represents the critical step that determines assay selectivity, sensitivity, and robustness. This technical guide details the systematic approach to optimizing column chemistry, mobile phase composition, and gradient elution profiles to achieve high-resolution separation of target analytes from complex plasma matrices.
The quantification of drugs and their metabolites in human plasma via LC-MS/MS is foundational to pharmacokinetic, toxicokinetic, and bioequivalence studies. The chromatography system is the primary gatekeeper, responsible for separating the analyte from isobaric interferences, ion suppression agents, and matrix phospholipids. Optimization at this stage directly impacts the reliability of downstream mass spectrometric detection.
Core Optimization Parameters & Quantitative Data
Column Chemistry Selection
Stationary phase chemistry dictates retention mechanism and selectivity. The following table summarizes performance metrics for common column chemistries in plasma drug analysis.
Table 1: Performance of Common HPLC Column Chemistries for Plasma Drug Analysis
| Column Chemistry (Phase) | Typical Particle Size (µm) | Pore Size (Å) | Optimal pH Range | Key Mechanism | Best For |
|---|---|---|---|---|---|
| C18 (Octadecylsilane) | 1.7, 2.6, 3.5, 5 | 80-120 | 2-8 | Hydrophobic | Neutral, non-polar to moderately polar compounds |
| C8 (Octylsilane) | 1.7-5 | 80-120 | 2-8 | Moderate Hydrophobicity | Moderately polar to non-polar compounds; offers shorter retention than C18 |
| Phenyl-Hexyl | 1.7-3 | 80-120 | 2-8 | π-π Interactions + Hydrophobicity | Aromatic compounds; provides orthogonal selectivity to alkyl phases |
| PFP (Pentafluorophenyl) | 1.7-3 | 80-120 | 2-8 | Dipole-Dipole, π-π, H-bonding | Isomeric separation, polar compounds, bases, acids |
| HILIC (e.g., Silica, Amide) | 1.7-3 | 80-120 | 3-8 | Hydrophilic Partitioning | Highly polar, hydrophilic compounds (log P < 0) |
| Charged Surface Hybrid (CSH) | 1.7 | 130 | 1-12 | Electrostatic + Hydrophobic | Basic compounds at low pH; reduced secondary interaction |
Mobile Phase Optimization
Mobile phase composition and pH critically affect ionization efficiency, peak shape, and retention.
Table 2: Effect of Mobile Phase Modifiers on LC-MS/MS Signal for a Model Basic Drug (Propranolol)
| Aqueous Phase (A) | Organic Phase (B) | pH of A | Formic Acid (%) | Ammonium Formate (mM) | Peak Area (Counts) | Peak Asymmetry (As) |
|---|---|---|---|---|---|---|
| Water | Methanol | Unadjusted (~5.6) | 0.1 | 0 | 1.2e6 | 1.8 |
| Water | Methanol | Adjusted to 3.0 | 0.1 | 5 | 3.5e6 | 1.2 |
| Water | Acetonitrile | Unadjusted (~5.6) | 0.1 | 0 | 1.8e6 | 1.1 |
| Water | Acetonitrile | Adjusted to 3.0 | 0.1 | 5 | 4.1e6 | 1.05 |
| 10mM Ammonium Formate | Methanol | 3.0 | 0.1 | 10 | 3.8e6 | 1.15 |
| 10mM Ammonium Formate | Acetonitrile | 3.0 | 0.1 | 10 | 4.5e6 | 1.02 |
Gradient Elution Optimization
Gradient slope, initial and final organic composition, and column temperature govern resolution and cycle time.
Table 3: Impact of Gradient Slope on Resolution and Run Time for a 5-Component Drug Panel
| Initial %B | Final %B | Gradient Time (min) | Flow Rate (mL/min) | Column Temp (°C) | Average Resolution (Rs) | Total Run Time (min) | Max Backpressure (bar) |
|---|---|---|---|---|---|---|---|
| 5 | 95 | 5 | 0.4 | 40 | 1.5 | 8 | 380 |
| 5 | 95 | 8 | 0.4 | 40 | 2.8 | 11 | 370 |
| 5 | 95 | 5 | 0.6 | 40 | 1.2 | 6.5 | 580 |
| 5 | 95 | 8 | 0.6 | 40 | 2.5 | 9.5 | 570 |
| 10 | 90 | 8 | 0.4 | 40 | 2.4 | 11 | 360 |
| 10 | 90 | 8 | 0.4 | 50 | 2.6 | 11 | 310 |
Detailed Experimental Protocols
Protocol: Systematic Column Screening
Objective: To identify the optimal stationary phase for a set of target analytes.
- Sample: Prepare a standard mix of all target analytes and expected metabolites at 100 ng/mL in a solvent matching the initial mobile phase.
- Columns: Install five columns (e.g., C18, C8, Phenyl, PFP, HILIC) of identical dimensions (e.g., 100 x 2.1 mm, sub-3µm).
- Mobile Phase: Use a generic, pH-adjusted gradient. For reversed-phase: (A) 0.1% Formic acid/5mM Ammonium formate in water, pH 3.0; (B) 0.1% Formic acid in Acetonitrile.
- Gradient: 5-95% B over 8 minutes, hold 2 min, re-equilibrate for 3 minutes. Flow: 0.4 mL/min. Temp: 40°C.
- MS Detection: Use a generic MS scan or MRM transition for each compound.
- Evaluation: Rank columns based on peak capacity, symmetry (As, 0.9-1.2 ideal), and resolution of critical pairs.
Protocol: Mobile Phase Additive & pH Optimization
Objective: To maximize MS response and improve chromatographic peak shape.
- Fixed Conditions: Use the best column from 3.1. Use a generic gradient.
- pH Variation: Prepare mobile phase A with:
- 0.1% Formic Acid (pH ~2.7).
- 0.1% Acetic Acid (pH ~3.2).
- 10mM Ammonium Acetate, unadjusted (pH ~6.8).
- 10mM Ammonium Bicarbonate (pH ~8.0).
- Additive Variation: At the optimal pH, test Mobile Phase A with:
- No additive (acid only).
- 2mM, 5mM, and 10mM concentrations of ammonium formate or acetate.
- Organic Variation: Test Acetonitrile vs. Methanol as Organic Phase (B).
- Evaluation: Inject analyte standards. Plot peak area (response), signal-to-noise (S/N), and peak asymmetry against each condition.
Protocol: Gradient Slope & Profile Scouting
Objective: To achieve baseline resolution with minimal run time.
- Fixed Conditions: Use optimized column and mobile phase.
- Initial %B Test: Run gradients starting at 2%, 5%, and 10% B. Hold for 1 minute, then ramp to 95% B.
- Gradient Slope Test: Using the best initial %B, vary gradient time: 3, 5, 8, 10 minutes to 95% B.
- Non-linear Gradients: For complex mixtures, introduce a shallow segment (e.g., 1%/min) during elution of critical pairs, and a steep segment (e.g., 20%/min) elsewhere.
- Equilibration: Ensure a minimum of 5 column volumes of initial conditions between runs.
- Evaluation: Calculate resolution (Rs > 1.5 for baseline separation) for all adjacent peaks. Plot Rs vs. gradient time to find the "sweet spot."
Visualization of the Optimization Workflow
Title: LC-MS/MS Chromatography Optimization Decision Workflow
Title: Core Chromatography Parameters and Their Interaction
The Scientist's Toolkit: Essential Research Reagents & Materials
Table 4: Key Reagents and Materials for Chromatography Optimization
| Item | Function & Rationale | Example Product/Brand |
|---|---|---|
| LC-MS Grade Water | Aqueous mobile phase component; minimizes background ions and particulates that cause noise and column contamination. | Fisher Chemical LC-MS Grade, Optima LC/MS |
| LC-MS Grade Acetonitrile & Methanol | Organic modifiers; high purity is critical to reduce baseline noise and improve signal-to-noise. | Honeywell Burdick & Jackson LC-MS Grade |
| Ammonium Formate & Acetate (>99%) | Volatile buffer salts for pH and ionic strength control; ensure MS compatibility and prevent source contamination. | Sigma-Aldrich, MS Grade |
| Formic Acid & Acetic Acid (Optima LC/MS) | Volatile ion-pairing agents and pH modifiers; enhance [M+H]+ ionization and control peak shape for acids/bases. | Fisher Chemical, Optima LC/MS Grade |
| Drug & Metabolite Standards | For method development and system suitability testing; use certified reference materials (CRMs). | Cerilliant, Sigma-Aldrich CRM |
| Control (Blank) Plasma | Matrix for preparing calibration standards and QCs; defines baseline for selectivity assessment. | BioreclamationIVT, Golden West |
| SPE or PPT Plates/Columns | For sample preparation prior to LC-MS; critical for determining final matrix effects on chromatography. | Waters Oasis HLB, Phenomenex Strata |
| Column Selection Kit | Contains multiple column chemistries (C18, C8, phenyl, etc.) in identical formats for systematic screening. | Waters Cortecs, Phenomenex Kinetex Selectivity Kit |
| Permanent Needle Wash Solvent | High organic solvent (e.g., 90% ACN/Water) to prevent carryover in autosampler. | Custom prepared LC-MS grade mix. |
Within the systematic study of LC-MS/MS fundamentals for plasma drug quantification, method optimization is the critical determinant of sensitivity, selectivity, and robustness. This guide details the targeted tuning of mass spectrometry parameters—precursor/product ion selection, collision energy (CE), and dwell time—to translate analyte chemical properties into a reliable quantitative assay.
LC-MS/MS quantification of drugs in plasma follows a defined sequence: sample preparation, chromatographic separation, and mass spectrometric detection. Step 3, method tuning, bridges analyte chemistry and instrument physics. An unoptimized method yields poor sensitivity and reproducibility, undermining the entire analytical validation. This step is executed after initial compound infusion and before full method validation.
Systematic Optimization of MS/MS Parameters
Precursor and Product Ion Selection
The initial task is selecting the optimal precursor ion (typically [M+H]⁺ or [M-H]⁻) and the most intense, specific product ion.
Protocol: Product Ion Scan for Fragment Selection
- Prepare a standard solution of the analyte (~1 µg/mL) in a 50:50 mixture of mobile phase A and B.
- Directly infuse via syringe pump at 5-10 µL/min.
- Set the first quadrupole (Q1) to transmit the intact precursor ion (e.g., m/z of [M+H]⁺).
- Operate Q2 (collision cell) with a ramped collision energy (e.g., 10-50 eV).
- Scan the third quadrupole (Q3) over a suitable m/z range (e.g., 50 to precursor m/z) to record all fragments.
- Identify the 2-3 most abundant product ions. The most intense is typically the quantifier; the second most intense serves as the qualifier for confirmation.
Table 1: Example Product Ion Selection for Model Compounds
| Analyte (Precursor Ion) | Candidate Product Ions (m/z) | Relative Abundance (%) | Selection Rationale |
|---|---|---|---|
| Caffeine ([M+H]⁺ = 195.1) | 138.0 | 100 | Quantifier - Highest intensity |
| 110.0 | 85 | Qualifier - Sufficient intensity | |
| 83.0 | 45 | Diagnostic, but lower abundance | |
| Warfarin ([M-H]⁻ = 307.1) | 161.0 | 100 | Quantifier - Stable anion |
| 250.0 | 65 | Qualifier - Confirms structure |
Collision Energy (CE) Optimization
CE is the voltage applied in the collision cell to induce fragmentation. Its optimal value is compound-specific.
Protocol: Collision Energy Ramp
- Using the selected precursor/product ion pair, conduct a series of selected reaction monitoring (SRM) experiments while directly infusing the standard.
- Hold all parameters constant and vary the CE in increments of 2-5 eV across a plausible range (e.g., 5-40 eV).
- For each CE value, record the signal intensity of the product ion.
- Plot intensity vs. CE. The optimum is typically at the peak of this curve. Modern software often automates this via "Compound Optimization" routines.
Table 2: Empirical vs. Calculated Optimal CE for Representative Drugs
| Analyte | Transition (m/z) | Empirical Optimal CE (eV) | Predicted CE (Calculator) | Difference |
|---|---|---|---|---|
| Paracetamol | 152.1 → 110.0 | 18 | 16 | +2 |
| Omeprazole | 346.1 → 198.0 | 22 | 24 | -2 |
| Verapamil | 455.3 → 165.1 | 28 | 26 | +2 |
Dwell Time and Cycle Time Balancing
Dwell time is the time spent monitoring each SRM transition. It directly impacts signal-to-noise ratio (S/N) and the number of data points across a chromatographic peak.
Core Principle: Total Cycle Time = Σ (Dwell Time per transition) + Overhead Time. To achieve ~15-20 data points per peak, cycle time should be ≤ 1-2 seconds.
Protocol: Dwell Time Optimization for Multi-Analyte Panels
- Define all required SRM transitions (quantifier & qualifier for each analyte and internal standard).
- Set an initial dwell time (e.g., 50 ms). Calculate the cycle time.
- Inject a standard and check the peak shape (data points). If too few, increase dwell time.
- If cycle time is too long, prioritize: reduce dwell time for less critical transitions, remove unnecessary qualifier ions, or use scheduled SRM (where monitoring is centered on expected retention time).
Table 3: Impact of Dwell Time on Data Quality in a 5-Analyte Panel
| Dwell Time per Transition (ms) | Total Transitions | Approx. Cycle Time (s) | Avg. Data Points per Peak (Peak Width=6s) | Resulting S/N (Relative) |
|---|---|---|---|---|
| 100 | 12 | 1.2 | 5 | 100 |
| 50 | 12 | 0.6 | 10 | 71 |
| 20 | 12 | 0.24 | 25 | 45 |
The Scientist's Toolkit: Research Reagent Solutions
Table 4: Essential Materials for MS/MS Method Tuning
| Item | Function | Example/Notes |
|---|---|---|
| Analytical Standard | Provides pure analyte for tuning and calibration. | Certified reference material from USP or equivalent. |
| Stable Isotope-Labeled Internal Standard (SIL-IS) | Corrects for matrix effects and variability. | e.g., Drug-d3 or d5 analogs. Critical for plasma assays. |
| LC-MS Grade Solvents | Minimize background noise and ion suppression. | Methanol, Acetonitrile, Water (with 0.1% Formic Acid). |
| Plasma Matrix (Blank) | Used to assess selectivity and matrix effects. | Drug-free human plasma from pooled donors. |
| Syringe Pump & Infusion Set | Enables direct introduction of standard for tuning. | Hamilton syringes and PEEK tubing. |
| Tuning & Calibration Solution | For instrument mass calibration and performance check. | Vendor-specific solutions (e.g., APCI positive/negative mix). |
Integrated Optimization Workflow
The following diagram illustrates the logical sequence and decision points in the MS/MS method tuning process.
Diagram Title: MS/MS Parameter Tuning and Optimization Workflow
Precise tuning of precursor/product ions, collision energy, and dwell times is non-negotiable for developing a robust, sensitive, and specific LC-MS/MS method for plasma drug quantification. This process, while iterative, follows a logical sequence where each parameter's optimization is interdependent. The resulting method forms the core of a reliable assay capable of meeting the stringent demands of pharmacokinetic studies and therapeutic drug monitoring.
Within the framework of LC-MS/MS plasma drug quantification fundamentals research, the selection of an appropriate internal standard (IS) is paramount for achieving accurate, precise, and reproducible data. This whitepaper provides an in-depth technical comparison of the two principal categories of internal standards: stable-labeled analogs (SIL-IS) and structural (or analog) analogs. The choice between them fundamentally influences method performance, robustness, and the validity of pharmacokinetic conclusions.
Fundamental Principles and Comparative Analysis
The primary function of an IS is to correct for variability in sample preparation, matrix effects (ion suppression/enhancement), and instrument response. The efficacy of this correction is directly linked to the chemical and physicochemical similarity between the IS and the target analyte.
Table 1: Core Comparison of Internal Standard Types
| Characteristic | Stable-Labeled Analog (SIL-IS) | Structural Analog |
|---|---|---|
| Definition | Identical chemical structure except for the incorporation of stable isotopes (e.g., ²H, ¹³C, ¹⁵N). | A different molecule with similar chemical structure and physicochemical properties. |
| Chromatographic Behavior | Nearly identical to the analyte. Co-elution is typical, ensuring identical matrix effects. | Similar but not identical. Slight retention time shifts are common, leading to potential differential matrix effects. |
| Ionization Efficiency | Identical in the ion source, as the chemical properties are the same. | Similar, but not guaranteed. Structural differences can alter ionization efficiency in the MS source. |
| Specificity in MS/MS | High. Different mass-to-charge (m/z) ratio prevents cross-talk. Monitored via a unique MRM transition. | Risk of Interference. Must be thoroughly vetted to ensure no endogenous compounds share its MRM transition. |
| Cost & Availability | High cost, custom synthesis often required. Limited availability for novel compounds. | Lower cost, often readily available from chemical catalogs. |
| Ideal Use Case | Regulatory bioanalysis (GLP/GCP), definitive method development, high precision required. | Early research, screening, when SIL-IS is unavailable or prohibitively expensive. |
Table 2: Quantitative Impact on Method Performance Metrics
| Performance Metric | Impact of SIL-IS | Impact of Structural Analog IS |
|---|---|---|
| Accuracy (%) | Typically 85-115% across calibration range. | May show bias, especially at LLOQ or in different matrices. |
| Precision (%CV) | Often <10-15% (intra- and inter-day). | Can be higher (>15%), less reproducible. |
| Matrix Effect Correction | Excellent. Compensates for both absolute and relative matrix effects due to co-elution. | Variable. May not fully compensate if elution time or ionization differs. |
| Linearity (R²) | >0.99 is routinely achievable. | Can be >0.99, but slope may be more sensitive to conditions. |
Experimental Protocols for IS Evaluation
Protocol 1: Assessment of Matrix Effect and IS Compensation
- Objective: To quantify absolute and relative matrix effects and evaluate the IS's ability to compensate for them.
- Procedure:
- Prepare three sets of samples in sextuplicate:
- Set A (Neat Solution): Analyte + IS in mobile phase.
- Set B (Post-Extraction Spiked): Drug-free plasma extracted, then analyte + IS spiked into the extracted blank matrix.
- Set C (Pre-Extraction Spiked): Analyte + IS spiked into drug-free plasma before extraction.
- Analyze all samples by LC-MS/MS.
- Calculate:
- Absolute Matrix Effect (ME%) = (Mean Peak Area of Set B / Mean Peak Area of Set A) × 100%.
- Process Efficiency (PE%) = (Mean Peak Area of Set C / Mean Peak Area of Set A) × 100%.
- IS-Normalized Matrix Factor = (Matrix Factor of Analyte) / (Matrix Factor of IS), where Matrix Factor = Peak Area in Matrix / Peak Area in Neat Solution.
- Prepare three sets of samples in sextuplicate:
- Interpretation: A perfect IS yields an IS-normalized matrix factor of 1.0. SIL-IS typically achieves values of 0.95-1.05, while structural analogs show greater deviation.
Protocol 2: Determination of Extraction Recovery with IS
- Objective: To measure the efficiency of the sample preparation process.
- Procedure:
- Prepare two sets of samples (n=6):
- Set 1 (Pre-Extraction Spike): Analyte + IS added to blank plasma before extraction.
- Set 2 (Post-Extraction Spike): Blank plasma extracted, then the same absolute amount of analyte + IS added to the extract.
- Analyze by LC-MS/MS.
- Calculate:
- Recovery (%) = (Mean Peak Area of Set 1 / Mean Peak Area of Set 2) × 100%.
- Prepare two sets of samples (n=6):
- Interpretation: While recovery need not be 100%, it must be consistent and high. The IS should track the analyte's recovery. SIL-IS demonstrates near-identical recovery; structural analogs may diverge.
Visualizing the Decision Pathway and Workflow
Title: Internal Standard Selection Decision Pathway
Title: LC-MS/MS Workflow & IS Tracking
The Scientist's Toolkit: Key Research Reagent Solutions
Table 3: Essential Materials for IS-Based LC-MS/MS Quantification
| Item / Reagent Solution | Function & Importance |
|---|---|
| Certified Stable-Labeled IS | Provides the gold standard for compensation. Must have sufficient isotopic purity (>99%) to avoid cross-contribution to the analyte channel. |
| Certified Reference Standard (Analyte) | High-purity material for preparing calibration standards. Defines the accuracy foundation of the assay. |
| Matrix-Free Diluent / Mobile Phase | For preparing neat solutions for assessing matrix effects. Must be LC-MS grade. |
| Control Blank Plasma (Biomatrix) | Sourced from multiple donors to assess matrix variability. Essential for validation of selectivity. |
| Protein Precipitation Solvent (e.g., MeCN, MeOH) | Common sample prep reagent. Choice affects recovery and matrix effect profile. Both analyte and IS must be soluble and stable in it. |
| Solid-Phase Extraction (SPE) Cartridges | For more selective sample clean-up. The IS must demonstrate identical retention/elution characteristics as the analyte on the sorbent. |
| LC-MS Grade Solvents & Additives | Minimize background noise and ensure consistent ionization. Critical for maintaining stable retention times. |
| Mass-Tuned Calibration Solution | For daily instrument calibration and tuning, ensuring optimal sensitivity and mass accuracy for both analyte and IS MRM transitions. |
Within the broader thesis on LC-MS/MS plasma drug quantification fundamentals, the design of the analytical run stands as the cornerstone of data integrity. This guide details the systematic construction of calibration curves and integration of quality control (QC) samples to ensure accuracy, precision, and reliability in pharmacokinetic and toxicokinetic studies.
Fundamentals of Run Design
A robust analytical run balances calibration standards and QC samples to monitor performance continuously. The sequence is designed to detect and correct for instrumental drift, matrix effects, and reagent degradation.
Table 1: Standard Analytical Run Sequence Structure
| Order | Sample Type | Purpose | Minimum Replicates |
|---|---|---|---|
| 1 | Blank Plasma | Check for interference | 1 |
| 2 | Zero Sample (Blank + IS) | Check for analyte/IS interference | 1 |
| 3-10 | Calibration Standards (e.g., 8 levels) | Define calibration curve | 1 each |
| 11 | LLQC (Low QC) | Assess sensitivity & lower limit | ≥3 |
| 12 | MQC1 (Mid QC 1) | Monitor curve performance | ≥3 |
| 13 | ULOQ Sample | Check upper limit accuracy | 1 |
| 14-... | Unknown Study Samples | Quantify unknowns | 1 each |
| ... | MQC2 (Mid QC 2) | Monitor mid-run performance | ≥3 |
| ... | HQC (High QC) | Assess high-end accuracy | ≥3 |
| Final | CMC (Carryover Check) | Assess carryover post-run | 1 |
Designing the Calibration Curve
The calibration curve establishes the relationship between instrument response and analyte concentration.
Experimental Protocol: Preparation of Calibration Standards
- Stock Solution Preparation: Dissolve certified reference standard in appropriate solvent (e.g., methanol) to create a primary stock solution (e.g., 1 mg/mL). Confirm purity via certificate of analysis.
- Working Solution Dilution: Serially dilute primary stock with solvent to create a working solution range covering the anticipated calibration span.
- Spiking of Matrix: Add precise volumes of working solutions to pooled, analyte-free human plasma. Use low-binding tubes. Typical calibration levels: 7-9 non-zero concentrations spanning the expected range (e.g., 0.1–500 ng/mL).
- Extraction: Process calibration standards identically to unknown samples (e.g., protein precipitation, liquid-liquid extraction, or solid-phase extraction).
- Analysis: Inject in increasing concentration order, excluding the highest concentration initially to prevent carryover bias.
Table 2: Example Calibration Curve Parameters for a Hypothetical Drug X
| Parameter | Specification | Typical Acceptance Criteria |
|---|---|---|
| Number of Levels | 8 (non-zero) | Minimum 6 (including LLOQ, ULOQ) |
| Concentration Range | 0.5 – 200 ng/mL | Should cover expected unknown conc. |
| Regression Model | Weighted (1/x²) Linear | Based on residual analysis |
| Correlation Coefficient (r) | >0.99 | |
| % Deviation of Back-Calculated Standards | ±15% (±20% at LLOQ) |
Role and Preparation of Quality Control Samples
QC samples are independent of the calibration curve and assess run acceptability.
Experimental Protocol: Preparation and Use of QC Samples
- QC Stock Preparation: Prepare from an independent weighing of reference standard or a separate stock solution dilution series.
- QC Concentration Levels: Prepare at four key concentrations:
- LLQC: 3x the Lower Limit of Quantification (LLOQ).
- MQC: Mid-range (e.g., ~30-50% of calibration range).
- HQC: High concentration (e.g., ~75-85% of ULOQ).
- Dilution QC (DQC): Above ULOQ, to be diluted during processing, validating dilution integrity.
- Matrix: Use the same pooled plasma lot as for calibration standards. Aliquot and store at ≤ -70°C.
- Placement in Run: Distribute in duplicate or triplicate at beginning, middle, and end of run (see Table 1).
Table 3: QC Sample Acceptance Criteria (Based on FDA/EMA Guidelines)
| QC Level | Within-Run Accuracy (% Nominal) | Within-Run Precision (%CV) | Total Run Acceptance Rule |
|---|---|---|---|
| LLOQ | 80–120% | ≤20% | ≥67% (4/6) of QCs must be within ±15% of nominal; ≥50% at each level. |
| LLQC | 85–115% | ≤15% | |
| MQC | 85–115% | ≤15% | |
| HQC | 85–115% | ≤15% |
Data Analysis and Run Acceptance
- Calibration Curve Fitting: Apply selected regression model. Inspect residuals for homoscedasticity.
- QC-Based Acceptance: The run is accepted only if QC samples meet predefined criteria (Table 3), regardless of calibration curve fit.
- Batch Rejection Triggers: Systematic failure of QCs at one level, consistent drift, or calibration standard failures exceeding limits.
Diagram Title: Analytical Run Workflow and QC Decision Tree
Diagram Title: Calibration and QC Pillars of Analytical Accuracy
The Scientist's Toolkit: Research Reagent Solutions
Table 4: Essential Materials for LC-MS/MS Plasma Quantification Runs
| Item | Function & Rationale |
|---|---|
| Certified Reference Standard (API) | Provides the definitive basis for quantification; purity and traceability are critical. |
| Stable Isotope-Labeled Internal Standard (IS) | Corrects for variability in extraction efficiency, ionization suppression/enhancement, and instrument drift. |
| Charcoal-Stripped or Blank Human Plasma | Serves as analyte-free matrix for preparing calibration standards and QC samples. |
| LC-MS Grade Solvents (MeOH, ACN, Water) | Minimizes background noise and ion suppression, ensuring consistent mobile phase performance. |
| Appropriate Buffers & Additives (e.g., Formic Acid, Ammonium Acetate) | Modifies pH and ionic strength to optimize analyte chromatography and ionization. |
| Solid-Phase Extraction (SPE) Plates/Cartridges or Protein Precipitation Plates | Enables high-throughput, reproducible sample clean-up to reduce matrix effects. |
| Low-Binding Microcentrifuge Tubes & Pipette Tips | Prevents adsorptive losses of analyte, especially critical for hydrophobic or low-concentration compounds. |
| Quality Control Plasma Pools (LLQC, MQC, HQC) | Independently prepared, aliquoted, and stored samples for run acceptance decisions. |
Solving Common LC-MS/MS Problems: Matrix Effects, Carryover, and Sensitivity Drops
Within the fundamental research on LC-MS/MS plasma drug quantification, the accuracy and reliability of analytical results are paramount. Matrix effects, manifesting as ion suppression or enhancement, represent a critical challenge. These phenomena alter the ionization efficiency of the target analyte in the electrospray ionization (ESI) source due to co-eluting matrix components, leading to inaccurate quantification, reduced sensitivity, and compromised method robustness. This whitepaper provides an in-depth technical guide to identifying, quantifying, and mitigating matrix effects to ensure data integrity in bioanalytical research.
Matrix effects primarily occur in the ESI interface. Co-eluting, non-volatile, or ionizable substances from the biological matrix (e.g., phospholipids, salts, metabolites, proteins, and concomitant medications) compete for access to droplet surfaces and charge, thereby influencing analyte ion yield. Phospholipids are the most cited endogenous cause of significant ion suppression, particularly in the later, more organic phase of reversed-phase gradients.
Diagram 1: Logical flow of matrix effect generation.
Quantitative Assessment of Matrix Effects
The most established method for evaluating matrix effects is the post-column infusion experiment and the post-extraction spike method, with calculation of the Matrix Factor (MF).
Table 1: Methods for Assessing Matrix Effects
| Method | Protocol Description | Calculation/Interpretation |
|---|---|---|
| Post-Column Infusion | 1. Continuously infuse analyte solution post-column into the MS.2. Inject a blank matrix extract via LC.3. Monitor ion signal across the chromatographic run time. | Signal dips (suppression) or peaks (enhancement) in the chromatogram indicate regions of matrix effect. Provides a qualitative map. |
| Post-Extraction Spike | 1. Prepare multiple lots of matrix (e.g., 6+ from different sources).2. Prepare Set A: Spiked before extraction.3. Prepare Set B: Spiked into extracted blank matrix.4. Prepare Set C: In pure mobile phase.5. Analyze all sets. | MF = Peak Area (Set B) / Peak Area (Set C)IS-Norm MF = MF(analyte) / MF(IS)MF ≈ 1: No effect. MF < 1: Suppression. MF > 1: Enhancement. CV of MF > 15% indicates significant variability. |
Experimental Protocol: Post-Extraction Spike Matrix Factor Determination
- Matrix Lots: Obtain at least six individual lots of blank control plasma (human and relevant animal species).
- Sample Preparation:
- Set A (Pre-extraction Spike): Spike analyte/internal standard (IS) into blank plasma, then perform extraction (e.g., protein precipitation, SPE, LLE).
- Set B (Post-extraction Spike): Extract blank plasma, then spike analyte/IS into the resulting neat extract.
- Set C (Neat Solution): Spike analyte/IS directly into mobile phase or reconstitution solvent.
- Analysis: Analyze all samples by LC-MS/MS.
- Data Analysis: Calculate MF and IS-normalized MF for each matrix lot. Report mean and coefficient of variation (CV%).
Table 2: Example Matrix Factor Data from a Hypothetical Plasma Assay
| Analyte/IS | Matrix Lot | Peak Area (Set B) | Peak Area (Set C) | MF | IS-Norm MF |
|---|---|---|---|---|---|
| Analytic X | Lot 1 | 45,200 | 50,000 | 0.90 | 1.02 |
| Lot 2 | 38,500 | 50,000 | 0.77 | 0.98 | |
| Lot 3 | 52,800 | 50,000 | 1.06 | 1.01 | |
| IS | Lot 1 | 505,000 | 500,000 | 1.01 | -- |
| Lot 2 | 490,000 | 500,000 | 0.98 | -- | |
| Lot 3 | 510,000 | 500,000 | 1.02 | -- | |
| Summary | Mean IS-Norm MF (CV%) | 1.00 (2.0%) |
Mitigation Strategies
Effective mitigation requires a multi-pronged approach focusing on sample preparation, chromatography, and internal standard selection.
4.1. Sample Preparation Optimization
- Liquid-Liquid Extraction (LLE): Effectively removes polar phospholipids and salts.
- Solid-Phase Extraction (SPE): Selective sorbents (e.g., hybrid phospholipid removal plates) can target phospholipids.
- Protein Precipitation (PPT) with Phospholipid Removal: Follow PPT with a phospholipid removal step (e.g., using dispersive SPE salts).
4.2. Chromatographic Resolution
- Longer Chromatographic Runs: Increases separation of analytes from matrix interferences.
- Improved Selectivity: Use of smaller particle columns (e.g., sub-2µm), different stationary phases (e.g., HILIC for polar analytes), or alternative mobile phase modifiers (e.g., ammonium fluoride) can shift retention times of interferences.
4.3. Internal Standardization
- Stable Isotope-Labeled Internal Standard (SIL-IS): The gold standard. Co-elutes with the analyte and experiences nearly identical matrix effects, perfectly normalizing for them.
- Structural Analog IS: Less ideal, as it may not experience identical matrix effects if retention time differs.
Experimental Protocol: Method Comparison for Matrix Effect Reduction
- Objective: Compare PPT vs. SPE for phospholipid removal.
- Procedure:
- Prepare blank plasma extracts using: a) Standard PPT with acetonitrile, b) Phospholipid removal SPE.
- Perform post-extraction spike (Set B) with analyte/IS into both extract types.
- Analyze via LC-MS/MS with a gradient elution.
- Use a post-column infusion of phospholipid precursor ions (m/z 184, 104) to monitor their elution profile.
- Analysis: Overlay phospholipid traces with analyte/IS retention times. Calculate and compare MF variability between the two methods.
Diagram 2: Workflow for mitigating matrix effects.
The Scientist's Toolkit: Key Research Reagent Solutions
Table 3: Essential Materials for Matrix Effect Studies
| Item / Reagent Solution | Function in Matrix Effect Research |
|---|---|
| Individual/Paired Blank Plasma Lots | (≥6 from different donors). Essential for assessing inter-individual variability of matrix effects. |
| Stable Isotope-Labeled Internal Standards (SIL-IS) | (²H, ¹³C, ¹⁵N-labeled). Critical for normalizing matrix effects; the cornerstone of reliable LC-MS/MS quantification. |
| HybridSPE-Phospholipid or Similar Plates/Tubes | Specialized sorbents for selective depletion of phospholipids from protein-precipitated samples. |
| LC Columns: C18, HILIC, PFP | Different selectivities to alter analyte and interference co-elution. Sub-2µm particles improve resolution. |
| Ammonium Formate/Fluori de/ Acetate | Alternative volatile buffers. Fluoride can reduce sodium adduct formation and alter selectivity. |
| Post-Column Infusion Kit | (T-union, infusion syringe pump). Required for qualitative post-column infusion experiments. |
| Phospholipid Standard Mix | Used to monitor and identify phospholipid elution regions during method development. |
Within the critical framework of LC-MS/MS plasma drug quantification fundamentals research, achieving optimal chromatographic performance is non-negotiable. Peak tailing, fronting, and retention time shifts directly compromise data integrity, affecting accuracy, precision, and the reliability of pharmacokinetic and bioanalytical conclusions. This guide provides a detailed technical examination of these phenomena, their root causes, and evidence-based mitigation strategies.
Core Chromatographic Anomalies: Causes and Quantitative Impact
The following table summarizes the primary anomalies, their common causes, and their quantifiable impact on method performance in plasma drug analysis.
Table 1: Summary of Chromatographic Anomalies in LC-MS/MS Plasma Assays
| Anomaly | Typical Causes (Plasma-Specific) | Key Impact Metrics | Acceptable Range (General Bioanalysis) |
|---|---|---|---|
| Peak Tailing (Asymmetry Factor, As > 1.2) | 1. Active sites on column (secondary interactions with basic drugs).2. Inadequate sample cleanup (matrix components).3. Mismatched injection solvent strength.4. Column void/degraded frit. | Tailing Factor (Tf), Asymmetry Factor (As), Plate Count (N). | Tailing Factor: 0.9 - 1.2 |
| Peak Fronting (As < 0.8) | 1. Column overload (concentration or volume).2. Sample solvent stronger than mobile phase.3. Channeling in column bed.4. Chemical reaction/degradation during elution. | Fronting Factor, Asymmetry Factor (As), Peak Capacity. | Asymmetry Factor: 0.8 - 1.2 |
| Retention Time Shift (ΔRT > ±0.1 min) | 1. Mobile phase pH/ion strength variability.2. Column temperature fluctuation (>±2°C).3. Stationary phase degradation/ligand loss.4. Pump flow rate inaccuracy.5. Gradual change in column conditioning from plasma matrix. | Absolute ΔRT, %RSD of RT, Signal Stability. | %RSD of RT: ≤ 2.0% |
Detailed Experimental Protocols for Diagnosis and Mitigation
Protocol 1: Systematic Diagnosis of Peak Tailing for Basic Drugs in Plasma
Objective: To identify the source of tailing for a basic analyte in a validated plasma LC-MS/MS assay.
Materials:
- LC-MS/MS system with binary pump, autosampler, and column oven.
- Analytical column: C18, 50 x 2.1 mm, 1.7-1.8 µm.
- Test Solutions: (1) Neat analyte in mobile phase, (2) Processed plasma sample (post-extraction), (3) Processed plasma sample spiked with analyte (post-extraction spike).
- Mobile Phase A: 0.1% Formic acid in water. Mobile Phase B: 0.1% Formic acid in acetonitrile.
- Guard column (identical phase).
Procedure:
- Inject the neat analyte solution (n=3). Calculate the tailing factor (Tf).
- If tailing is absent, inject the processed plasma blank (n=3). Observe the baseline for late-eluting, ion-suppressing peaks.
- Inject the processed, post-extraction spiked sample (n=3). Compare Tf to Step 1.
- If tailing is significantly worse in Step 3 versus Step 1, it indicates active site interaction likely exacerbated by matrix components.
- Mitigation Test A: Add 0.1-0.5% v/v of propylamine or dimethyloctylamine as a competing base to both mobile phases. Re-inject and assess Tf.
- Mitigation Test B: Replace Mobile Phase A with 10 mM ammonium formate buffer at pH 3.5. Re-inject and assess Tf.
- Install a fresh guard column or cut 5-10 mm from the inlet of the analytical column. Re-test.
Protocol 2: Investigating Retention Time Shifts Under High-Throughput Plasma Analysis
Objective: To determine if RT shifts are due to column degradation, mobile phase instability, or autosampler temperature effects.
Materials:
- As in Protocol 1.
- Quality Control (QC) samples at Low, Mid, and High concentrations (n=5 each per batch).
- Freshly prepared and 72-hour-old mobile phase buffers.
Procedure:
- Over a sequence of 150 injections of extracted plasma samples (including QCs), monitor the RT of the analyte and internal standard.
- Plot RT vs. injection number.
- Experiment A (Temperature): For a subset, vary the autosampler tray temperature between 4°C and 15°C. Measure ΔRT.
- Experiment B (Mobile Phase Age): After column re-equilibration, switch to the 72-hour-old mobile phase. Perform a sequence of 20 injections. Compare the drift rate to that observed in Step 2.
- Experiment C (Column Conditioning): After 150 injections, perform a step-gradient column wash (e.g., to 95% organic, hold 10 column volumes) followed by re-equilibration. Assess if the RT returns to its original value.
The Scientist's Toolkit: Research Reagent Solutions
Table 2: Essential Materials for Optimizing Plasma LC-MS/MS Chromatography
| Item | Function in Mitigating Woes |
|---|---|
| High-Purity Silanol-Shielded C18 Columns | Minimizes secondary interactions with basic/acidic analytes, reducing tailing. |
| Stable Isotope-Labeled Internal Standards (SIL-IS) | Compensates for RT shifts and matrix effects by co-eluting with the analyte. |
| LC-MS Grade Additives (FA, AA, NH4Fa, NH4Ac) | Provides consistent pH and ion-pairing for reproducible RT and peak shape. |
| Solid-Phase Extraction (SPE) Plates | Effective phospholipid and protein removal reduces column fouling and peak distortion. |
| In-Line 0.2 µm Filters & Guard Columns | Protects analytical column from particulate matter and irreversibly adsorbed matrix. |
| Precision Column Oven (±0.5°C) | Maintains constant temperature, critical for RT reproducibility. |
| Dedicated LC Systems for Plasma | Avoids cross-contamination from high-concentration standards or different matrices. |
Visualizing Diagnostic and Mitigation Workflows
Diagram Title: LC-MS/MS Peak Anomaly Diagnostic Tree
Diagram Title: Optimization Pathway for Robust Plasma Assays
In LC-MS/MS plasma drug quantification research, chromatographic anomalies are not mere inconveniences but fundamental challenges to data validity. A systematic, cause-driven approach—leveraging diagnostic protocols, robust reagents, and continuous system monitoring—is essential. By implementing the strategies outlined here, researchers can achieve the chromatographic integrity required for generating reliable, reproducible pharmacokinetic data that forms the foundation of sound drug development decisions.
1. Introduction: Sensitivity in LC-MS/MS Plasma Assays Within the fundamental research on LC-MS/MS for quantitative bioanalysis, achieving and maintaining a low Lower Limit of Quantification (LLOQ) is paramount. Sensitivity dictates the ability to detect low-concentration analytes, influencing key pharmacokinetic parameters. Signal loss, a primary obstacle to low LLOQ, is a multifaceted problem requiring systematic diagnosis. This technical guide details the sources of signal attenuation and provides a structured experimental protocol for its diagnosis, directly contributing to robust method development.
2. Systematic Diagnosis of Signal Loss: A Cascade Investigation Signal loss can occur at any stage from sample collection to detector response. The diagnostic workflow must follow the analytical chain logically.
Diagram Title: Signal Loss Diagnostic Workflow
3. Key Experimental Protocols for Diagnosis and Optimization
3.1. Protocol: Post-Column Infusion for Matrix Effect Assessment Objective: To visualize and localize ion suppression/enhancement throughout the chromatographic run. Materials: LC-MS/MS system, analyte standard solution, extracted blank plasma matrix. Procedure:
- Prepare a solution of the analyte at a concentration near the expected LLOQ.
- Infuse this solution post-column at a constant rate (e.g., 5-10 µL/min) via a T-connector.
- Inject a processed blank plasma sample onto the LC system.
- Monitor the MRM transition. A stable signal indicates no matrix effect. A dip (suppression) or peak (enhancement) in the baseline corresponds to co-eluting matrix components.
- Modify chromatography (gradient, column chemistry) to shift the analyte retention time away from suppression zones.
3.2. Protocol: Absolute and Relative Processed Sample Recovery Objective: Quantify losses incurred during sample preparation (e.g., protein precipitation, SPE, LLE). Materials: Analyte stock, control plasma, sample preparation materials. Procedure:
- Prepare three sets of samples in replicates (n=6):
- Set A (Unprocessed Reference): Spike analyte into neat mobile phase.
- Set B (Processed Spike): Spike analyte into blank plasma after the sample preparation steps are complete.
- Set C (Processed Extract): Spike analyte into blank plasma before sample preparation.
- Analyze all sets by LC-MS/MS.
- Calculate:
- Absolute Recovery (%) = (Mean Peak Area of Set C / Mean Peak Area of Set A) × 100.
- Process Efficiency/Relative Recovery (%) = (Mean Peak Area of Set C / Mean Peak Area of Set B) × 100. Recovery <85% often suggests optimization of extraction is needed.
3.3. Protocol: Source and Collision Cell Optimization for S/N Objective: Systematically optimize MS parameters for maximum signal-to-noise (S/N). Materials: Analyte standard (~10x expected LLOQ) in mobile phase. Procedure:
- Direct Infusion Tuning: Continuously infuse analyte to optimize compound-dependent parameters (DP, EP, CE, CXP) for maximum product ion signal.
- Flow Injection Analysis (FIA): Inject analyte via LC pump (no column) to optimize source/gas parameters (TEM, GS1, GS2, CUR, CAD) against a background of mobile phase.
- Chromatographic Optimization: Perform injections using the final method. Fine-tune ion transfer voltages (e.g., Entrance Potential) and collision cell parameters (e.g., CAD gas) to maximize the S/N ratio at the expected retention time, not just peak height.
4. Quantitative Data Summary: Common Causes & Impact on LLOQ Table 1: Typical Impact of Common Issues on LLOQ Signal and Corrective Actions
| Diagnosed Issue | Typical Signal Reduction Range | Primary Corrective Action | Expected LLOQ Improvement |
|---|---|---|---|
| Ion Suppression | 50 - 95% | Modify chromatographic separation; improve sample clean-up. | 2-10x |
| Poor Ionization Efficiency | 60 - 90% | Optimize source parameters (TEM, gas flows); consider derivatization. | 2-5x |
| Suboptimal MRM Transition | 40 - 80% | Re-optimize CE, DP; select alternative product ion. | 1.5-3x |
| Low Extraction Recovery | 30 - 70% | Change extraction chemistry (e.g., switch SPE sorbent, adjust pH for LLE). | 1.5-3x |
| Non-specific Adsorption | 20 - 50% | Use silanized vials; add carrier protein or competing amine to matrix. | 1.2-2x |
| In-source Fragmentation | 30 - 60% | Lower source temperature (TEM) or declustering potential (DP). | 1.5-2x |
5. The Scientist's Toolkit: Essential Research Reagents & Materials Table 2: Key Reagents and Materials for Sensitivity Optimization
| Item | Primary Function | Application in Sensitivity Research |
|---|---|---|
| Stable Isotope-Labeled Internal Standard (SIL-IS) | Corrects for variability in sample prep and ionization. | Mandatory for accurate quantification; minimizes matrix effect impact. |
| High-Purity MS-Grade Solvents & Buffers | Minimize chemical background noise. | Essential for reducing baseline noise, improving S/N at LLOQ. |
| Specialized SPE Sorbents (e.g., Mixed-Mode, HLB) | Selective analyte extraction and matrix removal. | Increases analyte concentration and reduces ion suppression. |
| Low-Binding Microtubes & Vials (e.g., polypropylene with silanized treatment) | Prevent adsorptive loss of analyte. | Critical for hydrophobic or peptide analytes prone to surface adhesion. |
| Chemical Derivatization Reagents | Enhance ionization efficiency of poor ionizers. | Used to add a permanently charged moiety or improve proton affinity. |
| Phospholipid Removal Plates (e.g., HybridSPE) | Selective removal of phospholipids, a major cause of suppression. | Pre-treatment step to significantly reduce matrix effects in plasma. |
6. Integrated Improvement Pathway Improving LLOQ is an integrative exercise. The relationship between core improvement strategies is synergistic.
Diagram Title: Integrated LLOQ Optimization Strategy
7. Conclusion A systematic, experimental approach to diagnosing signal loss is foundational to advancing LC-MS/MS plasma quantification. By sequentially investigating the MS/MS system, chromatography, sample preparation, and matrix effects, researchers can identify the limiting factor for their specific assay. Implementing the targeted protocols and utilizing the appropriate tools detailed herein allows for rational optimization, directly leading to improved sensitivity, lower LLOQs, and more robust bioanalytical methods essential for cutting-edge drug development research.
Within the critical framework of LC-MS/MS plasma drug quantification fundamentals research, system carryover represents a pivotal challenge to data integrity. Carryover, the undesired transfer of analyte from a previous sample into a subsequent one, directly compromises accuracy, precision, and the lower limit of quantification (LLOQ), invalidating key pharmacokinetic parameters. This technical guide provides an in-depth examination of carryover sources, diagnostic methodologies, and evidence-based cleaning protocols essential for robust bioanalytical method development and validation.
Carryover originates from multiple points within the LC-MS/MS workflow, each with distinct physicochemical mechanisms.
Autosampler-Based Carryover
The primary source, often accounting for >90% of total carryover. Mechanisms include:
- Adsorption: Analyte adsorption to polymeric surfaces (e.g., syringe plunger, needle seat, injection valve rotor).
- Retention: Incomplete elution from the needle, needle port, or sample loop.
- Droplet Formation: Residual droplets on the needle exterior or within a poorly flushed injection pathway.
Chromatographic System Carryover
- Column Adsorption: Irreversible or slowly reversible binding of analyte or metabolites to active silanol sites or metal impurities in the stationary phase.
- Pre-column & Connection: Accumulation in pre-column frits, guard columns, or in the void volumes of poorly swept fittings and tubing.
Mass Spectrometer Source Carryover
- Ion Source Deposition: Non-volatile residues accumulating on the sprayer, orifice, or skimmer cones, leading to gradual analyte release.
- Collision Cell Memory: For compounds with specific fragmentation patterns, residual precursor or product ions within the collision cell or quadrupoles.
Table 1: Quantitative Impact of Common Carryover Sources
| Source Component | Typical Contribution to Total Carryover (%) | Primary Mechanism | Key Influencing Factors |
|---|---|---|---|
| Autosampler Syringe & Needle | 60-80% | Adsorption, Retention | Sample Solvent, Needle Material, Wash Solvent |
| Injection Valve & Loop | 10-20% | Adsorption, Dead Volume | Rotor Seal Material, Flush Volume |
| Analytical Column | 5-15% | Irreversible Binding | Stationary Phase Chemistry, Mobile Phase pH |
| MS Ion Source | 1-5% | Deposition & Gradual Release | Source Temperature, Drying Gas Flow |
Diagnostic and Quantification Protocols
A systematic diagnostic approach is required to isolate and quantify carryover.
Standard Carryover Assessment Protocol
Objective: Quantify total system carryover as per regulatory guidance (FDA, EMA). Procedure:
- Sequence: Inject a blank matrix sample (e.g., processed plasma), followed by a high-concentration calibration standard (typically at the upper limit of quantification, ULOQ), followed by at least three consecutive blank matrix injections.
- LC-MS/MS Analysis: Perform analysis using the validated bioanalytical method.
- Calculation: Quantify any peak response in the post-ULOQ blanks.
- % Carryover = (Peak Area in Blank Post-ULOQ / Mean Peak Area of ULOQ) × 100%
- Acceptance Criteria: Carryover should be ≤20% of the LLOQ response and ≤5% of the internal standard response. It must not interfere with quantitation.
Source Isolation Diagnostics
Experiment 1: Autosampler-Only Test.
- Protocol: Bypass the analytical column by connecting the autosampler outlet directly to the MS inlet (or to a waste line if necessary). Perform the standard carryover assessment sequence (blank → ULOQ → blanks). Any signal in the blanks is attributable solely to the autosampler and injection valve.
Experiment 2: Column & LC Path Test.
- Protocol: After a confirmed system clean, inject the ULOQ standard. Immediately after the peak elutes, switch the valve to bypass the column, directing mobile phase to waste. Inject a series of blanks. Signal in these blanks indicates carryover from the column and LC tubing downstream of the injection valve.
Table 2: Diagnostic Experiment Outcomes and Interpretation
| Diagnostic Experiment | Components Tested | Positive Result Indicates | Mitigation Focus |
|---|---|---|---|
| Full System Test | Entire LC-MS/MS Flow Path | Total System Carryover | General Protocol Review |
| Autosampler-Only | Syringe, Needle, Valve, Loop | Autosampler Contribution | Wash Solvent Optimization |
| Column Bypass Test | Column, Post-column tubing | Column/LC Path Contribution | Mobile Phase/Column Change |
Cleaning and Mitigation Procedures
Mitigation is multi-faceted, targeting specific sources identified through diagnostics.
Autosampler Wash Optimization Protocol
Principle: Use wash solvents with stronger elution strength than the sample solvent. Systematic Optimization Method:
- Prepare Test Solutions: ULOQ standard and series of blanks.
- Design Wash Solvents: Test combinations (e.g., Wash 1: High organic (90% ACN/MeOH); Wash 2: Aqueous with additive (e.g., 0.1% Formic Acid); Wash 3: Strong solvent (e.g., DMSO, Isopropanol, or 5% Ammonium Hydroxide) for stubborn carryover.
- Vary Parameters: Test different wash volumes (e.g., 500 µL to 2 mL per wash) and wash locations (needle interior and exterior).
- Execute Test: Run sequence: Blank → ULOQ → Blank. Repeat for each wash protocol.
- Analyze: Calculate % carryover. Select protocol that reduces it below the acceptance criterion.
Chromatographic Mitigations
- Strong Needle Wash: Implement a wash port containing a solvent stronger than the mobile phase.
- Column Flushing: Integrate a high-strength flush step at the end of each injection cycle or batch. Example: 5-minute flush with 95:5 MeOH:Isopropanol at 0.2 mL/min, followed by re-equilibration.
- Use of Trap Columns: For very sticky compounds, online solid-phase extraction (SPE) or trap-and-elute setups can isolate the analyte load to a disposable cartridge.
MS Source Cleaning Protocol
Frequency: As indicated by increasing system background or carryover. Procedure:
- Disassemble: Safely remove and disassemble the ion source according to manufacturer instructions (sprayer, cone, skimmer).
- Sonication: Sonicate components sequentially in: a) HPLC-grade methanol (10 min), b) 50:50 methanol:water (10 min), c) 5% ammonium hydroxide solution (if safe for material, 5 min), d) HPLC-grade water (10 min).
- Drying & Reassembly: Dry thoroughly with a stream of nitrogen or argon gas and reassemble.
Table 3: Efficacy of Common Mitigation Strategies
| Strategy | Target Component | Typical Carryover Reduction Achieved | Key Consideration |
|---|---|---|---|
| Optimized Wash Solvent (e.g., IPA) | Autosampler | 70-95% | Compatibility with seals/plungers |
| Increased Wash Volume (e.g., >1mL) | Autosampler/Valve | 30-60% | Increased cycle time |
| Post-Injection Column Flush | Analytical Column | 50-90% | Requires re-equilibration time |
| Needle Wash Port Usage | Needle Exterior | 40-80% | Requires hardware configuration |
| Regular MS Source Cleaning | Ion Source/Cones | 60-85% | Requires system downtime |
The Scientist's Toolkit: Essential Research Reagents & Materials
Table 4: Key Reagent Solutions for Carryover Investigation & Mitigation
| Item/Category | Function in Carryover Studies | Example & Notes |
|---|---|---|
| Strong Wash Solvents | Displace adsorbed analyte from autosampler surfaces. | Dimethyl Sulfoxide (DMSO): Excellent for hydrophobic compounds. Isopropanol (IPA): Good general-purpose strong solvent. 5% Ammonium Hydroxide: For basic compounds (check material compatibility). |
| Additive-Enhanced Wash | Modify pH/ionic strength to disrupt analyte-surface binding. | 0.1-1.0% Formic Acid/Acetic Acid: For basic compounds. 0.1-1.0% Ammonium Hydroxide: For acidic compounds. |
| Matrix-Based Wash/Blank | Mimic sample composition to assess non-specific binding. | Processed Plasma Blank: Double- or single-extracted blank matrix to diagnose matrix-mediated carryover. |
| Column Regeneration Solvents | Strip strongly bound residues from analytical column. | 95:5 Methanol:IPA, 0.1% Trifluoroacetic Acid in Water, or 50:50 Acetonitrile:Water with 0.1% FA for flushing protocols. |
| MS Source Cleaning Solutions | Remove non-volatile deposits from MS interface components. | HPLC-grade Methanol, Acetonitrile, Water. 5% Ammonium Hydroxide or 1% Acetic Acid for sonication (verify component compatibility first). |
| Inert Hardware Components | Reduce active adsorption sites in flow path. | PEEKsil or SilcoTek treated tubing/parts, CERTAINTY Autosampler Syringes: Feature inert, durable surfaces. |
This whitepaper, framed within a broader thesis on LC-MS/MS plasma drug quantification fundamentals, details the application of two-dimensional liquid chromatography (2D-LC) with heart-cutting as a critical solution for analyzing complex biological matrices. The accurate quantification of drugs and metabolites in plasma is fundamentally challenged by matrix interferences, isobaric compounds, and low analyte concentrations. Heart-cutting 2D-LC directly addresses these challenges by isolating specific, co-eluting regions of interest from the first dimension (¹D) and transferring them to a second dimension (²D) with orthogonal separation mechanics, thereby achieving the resolution and sensitivity required for robust bioanalytical method development in drug discovery and development.
Core Principles and Quantitative Comparisons
Comparison of 2D-LC Modalities
The choice of 2D-LC mode depends on the analytical challenge. For targeted quantification of specific analytes in plasma, heart-cutting (LC-LC) is most efficient.
Table 1: Quantitative Comparison of 2D-LC Modalities
| Modality | Number of Cuts | Typical ²D Analysis Time | Peak Capacity Gain | Primary Application in Bioanalysis |
|---|---|---|---|---|
| Heart-Cutting (LC-LC) | Selective (1-10) | 1-5 min per cut | Moderate (10-50x) | Targeted quantification, interference removal |
| Comprehensive (LC×LC) | All fractions | Seconds per fraction | High (10-1000x) | Untargeted profiling, metabolomics |
| Multiple Heart-Cutting (mLC-LC) | Many (10-100) | 1-3 min per cut | High (50-200x) | Multi-analyte targeted assays |
Quantitative Performance Metrics
Implementation of 2D-LC yields measurable improvements in key bioanalytical figures of merit.
Table 2: Performance Enhancement with Heart-Cutting 2D-LC vs. 1D-LC
| Performance Metric | Typical 1D-LC-MS/MS Result | Typical 2D-LC (Heart-Cut) Result | Improvement Factor |
|---|---|---|---|
| Signal-to-Noise (S/N) for Low Conc. | 15:1 | 45:1 | 3x |
| Matrix Effect (Ion Suppression, %) | -25% to +30% | -5% to +10% | >5x Reduction in Variability |
| Limit of Quantification (LOQ) | 1.0 ng/mL | 0.1 ng/mL | 10x |
| Inter-peak Resolution (Rs) of Critical Pair | 1.2 | >2.5 | Complete Baseline Separation |
Detailed Experimental Protocols
Protocol: Method Development for Heart-Cutting 2D-LC-MS/MS Plasma Analysis
Objective: To quantify a target drug and its isobaric metabolite in human plasma.
Materials: See "The Scientist's Toolkit" below.
Method:
- ¹D Separation Optimization:
- Use a C18 column (150 x 2.1 mm, 3.5 µm).
- Develop a gradient from 5% to 95% mobile phase B (0.1% Formic Acid in Acetonitrile) over 15 minutes, with A (0.1% Formic Acid in Water).
- Identify the retention time window (e.g., 6.5 - 7.5 min) containing the co-eluting analyte and interfering isobar.
Heart-Cutting Interface Configuration:
- Configure a two-position, six-port valve with two identical trapping columns (e.g., C18, 10 x 2.1 mm).
- Cut Phase: At 6.5 min, switch valve to direct the ¹D effluent containing the analytes onto Trap Column 1 for 1 minute.
- Elution & Analysis Phase: After the cut, switch valve to place Trap Column 1 in line with the ²D flow. Apply a fast, focused ²D gradient (e.g., 15% to 60% B in 2 min) on a orthogonal column (e.g., Phenyl-Hexyl) to separate the trapped compounds. While ²D analysis runs, the next ¹D cut can be collected on Trap Column 2.
²D Orthogonal Separation:
- Select a stationary phase with different selectivity (e.g., HILIC, Phenyl, Cyano). Here, a Phenyl-Hexyl column (50 x 3.0 mm, 2.7 µm) is used.
- Employ a high-flow-rate, shallow gradient for rapid re-separation of the heart-cut fraction.
MS/MS Detection:
- Use electrospray ionization (ESI) in positive mode.
- Optimize MRM transitions for the drug, its metabolite, and internal standard.
- Synchronize the mass spectrometer acquisition with the ²D elution profile.
Validation:
- Assess linearity, accuracy, precision, and matrix effects per FDA/EMA guidelines. Compare results against a 1D-LC-MS/MS method.
Visualized Workflows and Relationships
Diagram 1: Heart-Cutting 2D-LC-MS/MS Workflow (99 chars)
Diagram 2: Dual-Trap Column Valve Switching Logic (99 chars)
The Scientist's Toolkit
Table 3: Essential Research Reagent Solutions and Materials
| Item | Function/Application |
|---|---|
| C18 (¹D) and Phenyl-Hexyl (²D) UHPLC Columns | Provide orthogonal separation mechanisms; C18 for initial resolution, Phenyl for selectivity based on π-π interactions. |
| 0.1% Formic Acid in Water/Acetonitrile | Standard mobile phase additives for LC-MS to promote protonation and stable electrospray ionization. |
| Ammonium Acetate or Formate Buffers | Provide pH control and ionic strength for alternative separation modes (e.g., HILIC in ²D). |
| Stable Isotope-Labeled Internal Standards (SIL-IS) | Correct for variability in sample prep, ionization efficiency, and matrix effects; crucial for accurate quantification. |
| Protein Precipitation Reagents (e.g., Acetonitrile, Methanol with 0.1% FA) | Rapid removal of plasma proteins to protect LC columns and reduce matrix complexity. |
| Polymeric SPE Sorbents (e.g., HLB) | For off-line sample cleanup prior to 2D-LC, removing phospholipids that cause ion suppression. |
| Two-Position/Six-Port or Ten-Port Switching Valves | The heart of the interface; enables precise fraction transfer and trap column alternation. |
| Low-Dead-Volume PEEK or Stainless Steel Trapping Columns | Capture and focus the heart-cut fraction with minimal band broadening before ²D separation. |
Proving Your Method: FDA/EMA Bioanalytical Method Validation Guidelines and Best Practices
This technical guide details the core validation parameters for robust Liquid Chromatography-Tandem Mass Spectrometry (LC-MS/MS) methods used in quantitative bioanalysis of drugs in plasma. These parameters form the foundation of any reliable method supporting pharmacokinetic, toxicokinetic, and bioequivalence studies in drug development. Adherence to this blueprint ensures data integrity and regulatory compliance.
Core Validation Parameters
Accuracy and Precision
Accuracy defines the closeness of the measured value to the true value, while precision describes the closeness of repeated measurements. For LC-MS/MS bioanalysis, they are assessed through Quality Control (QC) samples at multiple concentrations.
Table 1: Acceptance Criteria for Intra-day and Inter-day Accuracy & Precision (EMA & FDA Guidelines)
| Parameter | Level | Acceptance Criteria |
|---|---|---|
| Accuracy | LLOQ QC | Mean within ±20% of nominal |
| Low, Mid, High QC | Mean within ±15% of nominal | |
| Precision (CV%) | LLOQ QC | ≤ 20% |
| Low, Mid, High QC | ≤ 15% |
Protocol: Experiment for Assessing Accuracy & Precision
- Preparation: Prepare calibration standards and QC samples (at Lower Limit of Quantification (LLOQ), Low, Mid, and High concentrations) in the appropriate biological matrix (e.g., human plasma) from independent stock solutions.
- Analysis: Analyze at least six replicates of each QC level in a single analytical run (intra-day) and over at least three different runs (inter-day).
- Calculation: Calculate the mean measured concentration, percent deviation from nominal (Accuracy), and coefficient of variation (CV%) (Precision).
- Acceptance: Results must meet criteria in Table 1.
Selectivity and Specificity
Selectivity is the ability to measure the analyte unequivocally in the presence of other matrix components (e.g., phospholipids, endogenous compounds). Specificity refers to the lack of interference from metabolites or co-administered drugs.
Protocol: Experiment for Assessing Selectivity
- Sample Sources: Obtain at least six individual lots of blank matrix from relevant sources. Include hemolyzed and lipemic lots if applicable.
- Sample Preparation: Process and analyze each blank lot with and without spiking the internal standard (IS).
- Evaluation: At the retention times of the analyte and IS, the response in blank samples should be <20% of the LLOQ response for the analyte and <5% of the IS response.
Table 2: Summary of Interference Acceptance Limits for Selectivity
| Interference Source | Maximum Allowable Response |
|---|---|
| Analyte at LLOQ | <20% of LLOQ response in blank matrix |
| Internal Standard | <5% of IS response in blank matrix |
Linearity
Linearity is the ability of the method to produce results directly proportional to analyte concentration within a specified range, defined by the LLOQ and the Upper Limit of Quantification (ULOQ).
Protocol: Experiment for Assessing Linearity
- Calibration Curve: Prepare and analyze calibration standards at a minimum of six concentration levels, spanning the entire range (LLOQ to ULOQ).
- Regression Model: Fit the data using a least-squares regression model (e.g., linear, quadratic). The chosen model is evaluated based on the correlation coefficient (r), residual plot, and accuracy of back-calculated standards.
- Acceptance Criteria: At least 75% of standards (including LLOQ and ULOQ) must back-calculate to within ±15% of nominal (±20% for LLOQ). The correlation coefficient (r) is typically expected to be ≥0.99.
Table 3: Example Back-Calculation Acceptance for Linearity Assessment
| Standard Level | Number of Standards | Accuracy Requirement |
|---|---|---|
| LLOQ | Minimum 1 | ±20% |
| All others (Low to ULOQ) | ≥75% of total | ±15% |
The Scientist's Toolkit: Essential Research Reagent Solutions
Table 4: Key Materials for LC-MS/MS Plasma Method Development & Validation
| Item | Function |
|---|---|
| Stable Isotope-Labeled Internal Standard (IS) | Corrects for variability in sample preparation and ionization; improves accuracy and precision. |
| Drug-Free Biological Matrix | Matching the study sample matrix (e.g., human, rat plasma) for preparing calibration standards and QCs. |
| Analytical Reference Standard | High-purity compound for preparing stock solutions to establish identity, potency, and concentration. |
| Protein Precipitation Solvents | Acetonitrile, methanol, or acidified versions to denature and remove plasma proteins prior to analysis. |
| LC-MS/MS Mobile Phases | A: Aqueous phase (e.g., water with 0.1% formic acid). B: Organic phase (e.g., acetonitrile with 0.1% formic acid). Enables chromatographic separation. |
| Solid-Phase Extraction (SPE) Cartridges | Optional for selective cleanup and concentration of analyte from complex matrices, improving sensitivity. |
Visualizing the Validation Workflow
Diagram 1: Core Method Validation Workflow Sequence
Diagram 2: Generic LC-MS/MS Plasma Analysis Workflow
Within the rigorous domain of LC-MS/MS plasma drug quantification fundamentals research, data integrity is non-negotiable. The accuracy of pharmacokinetic, toxicokinetic, and bioequivalence studies hinges on the demonstrable stability of the analyte from sample collection to final instrumental analysis. This technical guide provides an in-depth examination of four critical stability types: bench-top, freeze-thaw, long-term, and processed sample (autosampler) stability. Establishing these parameters is a fundamental prerequisite for any validated bioanalytical method, ensuring that concentration measurements reflect the in vivo state and not artifacts of the in vitro handling process.
Core Stability Types: Definitions and Impact
- Bench-Top Stability: Assesses the analyte's integrity under the typical conditions of sample preparation (e.g., room temperature or on-ice). It validates the handling period before processing or freezing.
- Freeze-Thaw Stability: Evaluates the analyte's ability to withstand cyclical temperature changes, simulating the removal of samples from storage for re-analysis or batch processing.
- Long-Term Stability: Determines the maximum duration an analyte remains stable in the biological matrix at the designated storage temperature (typically -70°C or -80°C), defining the study's archival window.
- Processed Sample Stability: Confirms that the extracted analyte in the final injection solvent is stable in the autosampler under the set temperature (e.g., 4°C, 10°C) for the duration of an analytical batch run.
Experimental Protocols for Stability Assessment
The foundational protocol for all stability experiments follows the principles outlined by regulatory guidance (FDA, EMA). The core design involves comparison against freshly prepared calibration standards and quality controls (QCs).
General Protocol Framework
- QC Preparation: Prepare low, mid, and high concentration QC samples in the target biological matrix (e.g., human plasma) from independently weighed stock solutions.
- Stability Sample Treatment: Subject the QC samples to the specific stress condition (e.g., leave at room temperature, undergo freeze-thaw cycles, store long-term).
- Comparison Sample Preparation: On the day of analysis, prepare fresh calibration standards and fresh QCs from new stock/spikes.
- Co-Analysis: Process the stability-treated QCs alongside the freshly prepared calibration standards and fresh QCs in a single analytical batch.
- Data Analysis: Calculate the concentration of the stability QCs using the fresh calibration curve. The mean measured concentration is compared to the nominal concentration (or to the mean of fresh QCs). Stability is demonstrated if the mean bias is within ±15% of the nominal value.
Specific Methodologies
- Bench-Top Stability: Spike QC samples, leave them exposed at room temperature (e.g., 4, 8, 24 hours) covering the maximum expected preparation time. Process and analyze against a fresh curve.
- Freeze-Thaw Stability: Subject QC samples to at least three cycles. A cycle involves thawing unassisted at room temperature, holding completely thawed for a defined period (e.g., 1-2 hours), and refreezing at the storage temperature (-70°C) for a minimum of 12 hours.
- Long-Term Stability: Store QC samples at the intended storage temperature (e.g., -70°C ± 10°C). Remove and analyze replicates at predetermined intervals (e.g., 1, 3, 6, 12, 24 months) against a freshly prepared calibration curve.
- Processed Sample Stability: After extraction, place the reconstituted QC samples in the autosampler set to the method-specific temperature. Analyze them sequentially over the anticipated batch duration (e.g., up to 72 hours). The initial injection serves as the "time zero" reference.
Table 1: Typical Stability Acceptance Criteria & Experimental Design
| Stability Type | Storage Condition | Typical Duration Tested | Minimum # of Replicates (per level) | Acceptance Criterion (Mean Bias) |
|---|---|---|---|---|
| Bench-Top | Room Temperature | ≥ Maximum prep time | 3 | Within ±15% of nominal |
| Freeze-Thaw | -70°C to RT cycles | ≥ 3 cycles | 3 | Within ±15% of nominal |
| Long-Term | -70°C ± 10°C | ≥ Project sample archival time | 3 | Within ±15% of nominal |
| Processed Sample | Autosampler (e.g., 4-10°C) | ≥ Maximum batch runtime | 3 | Within ±15% of nominal |
Table 2: Example Stability Data for a Hypothetical Small Molecule Drug "X" in Plasma
| Stability Type | QC Level (ng/mL) | Mean Conc. Found (ng/mL) | % Bias | %CV | Conclusion |
|---|---|---|---|---|---|
| Bench-Top (24h, RT) | LLOQ (1.00) | 0.95 | -5.0 | 4.2 | Stable |
| Low (3.00) | 3.15 | +5.0 | 3.1 | Stable | |
| High (750) | 735 | -2.0 | 2.5 | Stable | |
| Freeze-Thaw (3 cycles) | Low (3.00) | 2.91 | -3.0 | 5.5 | Stable |
| High (750) | 780 | +4.0 | 3.8 | Stable | |
| Long-Term (-70°C, 12 mo) | Low (3.00) | 2.82 | -6.0 | 6.0 | Stable |
| High (750) | 795 | +6.0 | 4.1 | Stable | |
| Processed (4°C, 72h) | Low (3.00) | 3.18 | +6.0 | 4.8 | Stable |
| High (750) | 720 | -4.0 | 3.3 | Stable |
The Scientist's Toolkit: Key Research Reagent Solutions
Table 3: Essential Materials for LC-MS/MS Stability Studies
| Item | Function & Relevance to Stability |
|---|---|
| Stable-Labeled Internal Standards (IS) | Deuterated or 13C/15N analogs of the analyte. Compensates for variability in extraction and ionization, critical for accurate stability assessment. |
| Blank Control Matrix | Drug-free plasma from the same species. Must be screened for interference and be representative of study samples. |
| Matrix Stabilizers | Enzyme inhibitors (e.g., NaF for esterases), antioxidants, or acidifiers. Used to prevent ex vivo degradation, establishing initial stability. |
| Low-Binding Tubes/Pipette Tips | Minimize adsorptive losses of hydrophobic or protein-bound drugs, a key factor in bench-top and processed sample stability. |
| Certified Storage Vials & Freezers | Vials with validated seals prevent evaporation/sublimation. Ultra-low temperature freezers with continuous monitoring ensure long-term stability. |
| LC-MS/MS System Suitability Solutions | Reference solutions to verify instrument performance (sensitivity, chromatography) before analyzing critical stability batches. |
Workflow and Decision Pathway for Stability Testing
Diagram 1: Stability Testing and Validation Workflow
Diagram 2: Sequential Stability Stress Points in Workflow
Within the framework of foundational research on LC-MS/MS plasma drug quantification, method robustness is paramount. Robustness, defined as a measure of a method's capacity to remain unaffected by small but deliberate variations in method parameters, is critically challenged by patient sample variables such as hemolysis and lipemia. These conditions introduce endogenous interferents (e.g., hemoglobin, lipids, cell debris) that can cause ion suppression/enhancement, matrix effects, and compromised accuracy. Dilution integrity testing, a key component of bioanalytical method validation, evaluates a method's ability to provide accurate and precise results when samples are diluted with blank matrix. This technical guide explores the intersection of these concepts, providing a rigorous examination of experimental strategies to validate method robustness against hemolyzed and lipemic plasma through dilution integrity assessments.
Impact of Hemolysis and Lipemia on LC-MS/MS Analysis
Hemolysis (release of red blood cell components) and lipemia (elevated lipid content) present distinct challenges:
- Hemolyzed Plasma: Introduces hemoglobin, heme, iron, and intracellular enzymes. These can cause:
- Ion Suppression: Primarily in the ESI+ mode due to non-volatile salts and phospholipids from cell membranes.
- Chemical Interference: Analyte degradation or adduct formation.
- Increased Background Noise: From co-eluting species.
- Lipemic Plasma: High concentrations of triglycerides, cholesterol, and phospholipids lead to:
- Matrix Effects: Significant ion suppression, especially for early-eluting analytes, due to competition for charge and droplet surface during ionization.
- Chromatographic Issues: Column fouling, retention time shifts, and increased backpressure.
- Extraction Inefficiency: Can impede protein precipitation or solid-phase extraction.
Experimental Protocols for Robustness Testing
Protocol for Preparation of Hemolyzed and Lipemic Quality Control (QC) Samples
Objective: To simulate real-world patient samples for robustness assessment.
Materials:
- Drug-free human plasma (K2EDTA).
- Whole blood from a donor (for hemolysis).
- Intralipid 20% or a lipid emulsion (for lipemia).
- Stock solution of analyte and internal standard (IS).
Method for Hemolyzed QC:
- Gently freeze-thaw whole blood or mechanically lyse red blood cells.
- Centrifuge at 10,000 x g for 10 minutes to obtain hemolyzed supernatant.
- Sparge hemolyzed supernatant with nitrogen to remove CO2.
- Mix the hemolyzed material with drug-free plasma to achieve target hemoglobin concentrations (e.g., 0.5, 1.0, 2.0 g/dL).
- Spike with analyte and IS to prepare Low, Mid, and High QC levels.
Method for Lipemic QC:
- Add a calculated volume of Intralipid 20% to drug-free plasma.
- Mix thoroughly to create a homogeneous, turbid lipemic matrix.
- Quantify lipemia by measuring triglyceride concentration or using a visual index.
- Spike with analyte and IS to prepare Low, Mid, and High QC levels.
Protocol for Dilution Integrity Testing with Abnormal Matrices
Objective: To demonstrate that samples exceeding the upper limit of quantification (ULOQ) can be reliably diluted with hemolyzed or lipemic blank matrix without affecting accuracy and precision.
Method:
- Prepare a sample at a concentration of 2-3x the ULOQ using the hemolyzed or lipemic blank matrix.
- Perform serial dilutions (e.g., 2-fold, 4-fold, 10-fold) using the corresponding abnormal blank matrix (hemolyzed or lipemic).
- Analyze these diluted samples alongside a freshly prepared calibration curve in normal plasma.
- Calculate the measured concentration for each dilution. The accuracy (mean % nominal) should be within ±15% and precision (%CV) ≤15%.
Table 1: Example Data from Dilution Integrity Testing in Lipemic Plasma (Theoretical)
| Nominal Conc. (ng/mL) | Dilution Factor | Matrix for Dilution | Mean Measured Conc. (ng/mL) | Accuracy (%) | Precision (%CV) |
|---|---|---|---|---|---|
| 500 (2.5x ULOQ) | 2 | Lipemic (Trig: 1000 mg/dL) | 487 | 97.4 | 3.2 |
| 500 (2.5x ULOQ) | 5 | Lipemic (Trig: 1000 mg/dL) | 510 | 102.0 | 4.1 |
| 500 (2.5x ULOQ) | 10 | Lipemic (Trig: 1000 mg/dL) | 492 | 98.4 | 5.7 |
Table 2: Impact of Hemolysis Level on Matrix Effect (% Ion Suppression)
| Hemoglobin (g/dL) | Analyte A (ME%) | Analyte B (ME%) | Internal Standard (ME%) |
|---|---|---|---|
| 0 (Normal) | -5.2 | -2.1 | -3.8 |
| 0.5 | -12.7 | -8.9 | -10.4 |
| 1.0 | -25.3 | -18.5 | -22.1 |
| 2.0 | -41.8 | -35.2 | -38.7 |
Workflow for Assessing Method Robustness
Diagram 1: Robustness Assessment Workflow
The Scientist's Toolkit: Research Reagent Solutions
Table 3: Essential Materials for Dilution Integrity & Robustness Studies
| Item | Function & Rationale |
|---|---|
| Characterized Blank Plasma (K2EDTA) | Gold standard matrix for calibration. Must be screened for absence of hemolysis/lipemia and target analytes. |
| Hemolyzed Plasma Stock | Provides consistent, high-concentration hemoglobin source for spiking QCs to simulate in vivo hemolysis. |
| Lipid Emulsion (e.g., Intralipid) | A standardized, injectable fat emulsion used to reliably create lipemic plasma of known triglyceride content. |
| Stable Isotope-Labeled Internal Standard (SIL-IS) | Corrects for variability in extraction efficiency and matrix effects; essential for accurate LC-MS/MS quantification. |
| Post-Column Infusion Kit | Setup (T-union, infusion pump) to perform post-column analyte infusion for direct visualization of matrix effect regions in chromatograms. |
| Phospholipid Removal SPE Plates | Specialized solid-phase extraction plates designed to selectively retain phospholipids, mitigating a major source of lipemia-induced ion suppression. |
| Matrix Effect Evaluation Mix | A cocktail of compounds spanning a range of pKa/logP values to comprehensively probe ionization impacts across the chromatographic run. |
When robustness testing reveals susceptibility to hemolysis or lipemia, mitigation strategies include:
- Enhanced Sample Cleanup: Utilize phospholipid depletion plates or liquid-liquid extraction optimized for lipid removal.
- Chromatographic Resolution: Improve separation by adjusting the gradient to shift analyte retention away from the region where phospholipids and hemoglobin fragments elute.
- Effective Internal Standard: The SIL-IS must co-elute with the analyte to adequately compensate for matrix effects.
- Alternative Sample Diluents: In some cases, diluting with a solution containing a low percentage of organic solvent or acidified buffer can improve solubility and reduce matrix effects better than pure blank matrix.
In conclusion, thorough evaluation of dilution integrity in the context of hemolyzed and lipemic plasma is a non-negotiable component of robust LC-MS/MS method development for drug quantification. This rigorous approach, framed within fundamental bioanalytical research, ensures that methods are reliable for analyzing real-world clinical samples, ultimately supporting robust pharmacokinetic and toxicokinetic decision-making in drug development.
Within the fundamental research on LC-MS/MS plasma drug quantification, selecting the appropriate analytical platform is a critical decision. This technical guide provides a detailed comparison of Liquid Chromatography-Tandem Mass Spectrometry (LC-MS/MS) against two established platforms: Immunoassays and conventional High-Performance Liquid Chromatography with Ultraviolet detection (HPLC-UV). The evaluation focuses on performance parameters essential for drug development, including sensitivity, specificity, throughput, and cost.
Platform Comparison: Core Performance Data
Table 1: Quantitative Comparison of Analytical Platforms for Plasma Drug Quantification
| Parameter | LC-MS/MS | Immunoassays (e.g., ELISA) | Conventional HPLC-UV |
|---|---|---|---|
| Typical Sensitivity (LLOQ) | 0.1-1 pg/mL (highly compound-dependent) | 0.01-1 ng/mL | 1-10 ng/mL |
| Specificity | Very High (separates by mass & retention time) | Moderate to Low (cross-reactivity risk) | Moderate (co-eluting interferences) |
| Dynamic Range | 3-4 orders of magnitude | 2-3 orders of magnitude | 2-3 orders of magnitude |
| Multiplexing Capability | High (MRM allows many analytes/run) | Low (typically single analyte) | Low (typically single/few analytes) |
| Throughput | Medium-High (5-15 min runtime) | Very High (batch processing) | Low (20-40 min runtime) |
| Sample Volume | Low (10-50 µL plasma) | Medium (50-100 µL) | High (100-1000 µL) |
| Development Time/Cost | High (method optimization) | Low (kit-based) | Medium (chromatographic) |
| Per-Sample Cost | Medium | Low | Low-Medium |
| Key Strength | Universality, specificity, multiplexing | Throughput, ease of use, sensitivity for proteins | Simplicity, robustness for known, high-concentration analytes |
| Key Limitation | High capital cost, technical expertise | Specific reagents, limited specificity | Poor sensitivity, limited resolution |
Experimental Protocols for Cross-Platform Comparison
To empirically compare platforms, a standardized experimental approach is recommended.
Protocol 1: Method Comparison for a Small Molecule Drug in Plasma
- Objective: Compare the accuracy, precision, and sensitivity of LC-MS/MS, HPLC-UV, and a competitive ELISA for Drug X.
- Sample Preparation: Spike Drug X into blank human plasma across a concentration range (0.01, 0.1, 1, 10, 100, 1000 ng/mL). Process in triplicate.
- LC-MS/MS & HPLC-UV: Use a universal protein precipitation (PPT) with acetonitrile (3:1 v/v). Centrifuge, dilute supernatant with water.
- Immunoassay: Use kit-provided dilution buffer directly.
- Analysis:
- LC-MS/MS: Column: C18, 2.1x50 mm, 1.7 µm. Mobile Phase: A=0.1% Formic Acid in H2O, B=0.1% Formic Acid in MeOH. Gradient elution. MS: ESI+ MRM transition 300.2 -> 183.1.
- HPLC-UV: Column: C18, 4.6x150 mm, 5 µm. Isocratic elution: 45% Acetonitrile in 25mM phosphate buffer, pH 3.0. Flow: 1.0 mL/min. UV detection at 254 nm.
- ELISA: Follow commercial kit protocol. Incubate samples with conjugate, wash, add substrate, stop reaction, read absorbance at 450 nm.
- Data Analysis: Calculate mean observed concentration, accuracy (% bias), and precision (% CV) for each level. Construct correlation plots.
Protocol 2: Specificity Challenge Experiment
- Objective: Evaluate assay specificity against structurally similar metabolites.
- Procedure: Prepare plasma samples containing the parent drug (10 ng/mL) and a known metabolite (100 ng/mL), both individually and combined.
- Analysis: Run samples on all three platforms.
- Expected Outcome: LC-MS/MS will resolve and quantify each separately. HPLC-UV may show peak co-elution. Immunoassay may show significant positive bias in the combined sample due to cross-reactivity.
Visualization of Platform Selection Logic
Diagram Title: Analytical Platform Selection Logic for Plasma Drug Assays
Diagram Title: Core LC-MS/MS Tandem Mass Spectrometry Workflow
The Scientist's Toolkit: Key Research Reagent Solutions
Table 2: Essential Materials for LC-MS/MS Plasma Bioanalysis
| Item | Function & Explanation |
|---|---|
| Stable Isotope-Labeled Internal Standards (SIL-IS) | Deuterated or 13C-labeled analogs of the analyte. Compensates for matrix effects and losses in sample prep, ensuring quantification accuracy. |
| Mass Spectrometry-Grade Solvents | Acetonitrile, Methanol, Water with < 0.1% impurities. Minimizes chemical noise and ion suppression at the MS source. |
| Protein Precipitation Plates (e.g., 96-well) | Facilitates high-throughput sample prep. Polypropylene plates compatible with organic solvents for efficient protein removal. |
| Hybrid SPE-PPT Plates | Combine protein precipitation with solid-phase extraction in a single well. Provides cleaner extracts than PPT alone, reducing ion suppression. |
| LC Columns: C18, 2.1 x 50 mm, sub-2µm | Standard for high-resolution, fast UPLC separations. Small particle size increases efficiency and speed for bioanalysis. |
| Mobile Phase Additives (Formic Acid, Ammonium Acetate) | Aid in analyte protonation/deprotonation in the MS source. Critical for consistent and efficient ionization. |
| Matrix (Plasma) from Disease State/Control | For preparing calibration standards and quality controls. Must match the biological matrix of study samples for valid quantification. |
| Automated Liquid Handler | For precise, reproducible pipetting of samples, internal standards, and reagents. Essential for high-throughput workflows and minimizing error. |
Within the framework of LC-MS/MS plasma drug quantification fundamentals research, robust documentation and Standard Operating Procedures (SOPs) are the cornerstones of data integrity and regulatory compliance. Adherence to Good Clinical Laboratory Practice (GCLP) and Good Laboratory Practice (GLP) principles is not optional but a fundamental requirement for generating reliable, reproducible, and auditable data that supports drug development from preclinical studies through clinical trials. This guide details the technical implementation of these principles in a bioanalytical laboratory setting.
The Regulatory Framework: GLP vs. GCLP
The application of GLP or GCLP is dictated by the phase of research and the intended use of the data. The following table summarizes their core distinctions and applications in bioanalysis.
Table 1: Core Distinctions Between GLP and GCLP in Bioanalytical Research
| Aspect | Good Laboratory Practice (GLP) | Good Clinical Laboratory Practice (GCLP) |
|---|---|---|
| Primary Scope | Non-clinical, laboratory-based safety testing (e.g., toxicology, pharmacokinetics in animals). | Analysis of samples from human clinical trials, bridging non-clinical and clinical research. |
| Governing Principles | OECD Series on Principles of GLP, US FDA 21 CFR Part 58. | Hybrid of GLP principles and clinical laboratory guidelines (e.g., ICH E6 R2, CLIA). |
| Focus in LC-MS/MS | Integrity of the analytical process for preclinical PK/TK studies. | Integrity of both the analytical process AND the chain of custody of human clinical specimens. |
| Key Documentation | Study Plan, SOPs, Raw Data, Final Report. | Protocol, Laboratory Manual, SOPs, Subject-Specific Documentation, Clinical Study Report. |
| QA Involvement | QA audits the final report and critical phases. | QA audits the process from clinical site through analysis to reporting. |
Essential Components of a Compliant Documentation System
Standard Operating Procedures (SOPs)
SOPs provide step-by-step instructions to ensure consistency and quality. The following table lists critical SOPs for an LC-MS/MS bioanalytical laboratory.
Table 2: Essential SOPs for LC-MS/MS Plasma Bioanalysis
| SOP Category | Specific SOP Examples | Purpose in Compliance |
|---|---|---|
| Instrument & Software | Operation, Calibration, and Maintenance of LC-MS/MS Systems; Data Acquisition Software Validation. | Ensures instruments are fit for purpose and electronic data is secure and attributable. |
| Analytical Methods | Method Development, Validation, and Transfer; Sample Preparation (Protein Precipitation, SPE, LLE); System Suitability Testing. | Defines the validated process for generating reliable concentration data. |
| Sample Management | Receipt, Login, Storage, and Disposal of Biological Samples; Chain of Custody. | Maintains sample integrity and traceability, critical for GCLP. |
| Data Handling | Calculation of Results; Data Review and Approval; Management of Deviations/Out-of-Specification (OOS) Results. | Ensures accurate data processing and handles anomalies transparently. |
| Quality Assurance | Internal Audits; Corrective and Preventive Action (CAPA); Archiving of Records and Samples. | Provides oversight and drives continuous improvement. |
The Method Validation Protocol and Report
For LC-MS/MS quantification, a prospectively defined validation protocol following FDA/EMA guidelines is mandatory. Key experiments and their acceptance criteria are summarized below.
Table 3: Core Validation Experiments for a Quantitative LC-MS/MS Bioassay
| Validation Parameter | Experimental Protocol Summary | Typical Acceptance Criteria |
|---|---|---|
| Selectivity/Specificity | Analyze blank plasma from at least 6 individual sources. Check for interference at the retention times of analyte and internal standard (IS). | Peak area interference <20% of LLOQ and <5% of IS. |
| Accuracy & Precision | Analyze QC samples at LLOQ, Low, Mid, High concentrations (n≥5 per level) over at least 3 runs. | Intra- & inter-run accuracy: 85-115% (80-120% at LLOQ). Precision (CV) ≤15% (≤20% at LLOQ). |
| Calibration Curve | Analyze a minimum of 6 non-zero calibrators across the range, plus blank and zero samples. Use appropriate weighting (1/x, 1/x²). | Correlation coefficient (r) ≥0.99. ≥75% of calibrators (including LLOQ & ULOQ) within ±15% bias (±20% at LLOQ). |
| Matrix Effect & Recovery | Post-extraction addition vs. neat solution for matrix effect. Compare extracted samples vs. post-extraction spiked samples for recovery. | IS-normalized matrix factor CV ≤15%. Recovery need not be 100% but must be consistent and precise. |
| Stability | Bench-top, processed, freeze-thaw, and long-term storage stability in matrix. Evaluate at Low & High QC levels (n≥3). | Mean concentration within ±15% of nominal. |
The Analytical Run: Documentation in Practice
Each sample batch analysis must be thoroughly documented. The logical flow of data generation, review, and approval is critical for audit trails.
Diagram 1: Bioanalytical Run Data Flow and Review
The Scientist's Toolkit: Key Research Reagent Solutions
Table 4: Essential Materials for Regulated LC-MS/MS Bioanalysis
| Item | Function & Compliance Consideration |
|---|---|
| Certified Reference Standard | Provides the known quantity of analyte for calibration. Must have Certificate of Analysis (CoA) documenting purity, traceability, and storage conditions. |
| Stable Isotope-Labeled Internal Standard (IS) | Corrects for variability in sample preparation and ionization. Ideally, deuterated or ¹³C-labeled analog of the analyte. Purity and CoA are critical. |
| Control (Blank) Matrix | Typically, drug-free human plasma. Should be screened for absence of interference and characterized (e.g., anticoagulant). Sourcing documentation is vital. |
| Quality Control (QC) Material | Spiked samples at known concentrations (Low, Mid, High). Prepared in bulk, aliquotted, and stored with documented stability. Used to accept/reject analytical runs. |
| Documented Chemicals & Solvents | HPLC/MS-grade solvents and reagents. Lot numbers and expiration dates must be recorded in the analytical batch sheet. |
Data Integrity: ALCOA+ and Electronic Systems
Modern LC-MS/MS systems generate electronic records. Compliance requires adherence to ALCOA+ principles: Attributable, Legible, Contemporaneous, Original, Accurate, plus Complete, Consistent, Enduring, and Available.
The relationship between a Laboratory Information Management System (LIMS), the Analyst, and the Electronic Data is defined below.
Diagram 2: Data Flow in a Regulated Electronic Environment
In LC-MS/MS plasma drug quantification research, documentation and SOPs are the tangible implementation of GLP/GCLP quality systems. They transform scientific methodology into a controlled, transparent, and auditable process. By meticulously defining every step—from sample receipt to data archiving—and embedding data integrity principles into electronic workflows, laboratories generate evidence that withstands regulatory scrutiny and forms the reliable foundation for critical drug development decisions.
Conclusion
Mastering LC-MS/MS for plasma drug quantification requires a solid grasp of its fundamental principles, a meticulous approach to method development, proactive troubleshooting, and rigorous validation. By systematically addressing each of these pillars, researchers can generate data of the highest quality, essential for making critical decisions in drug discovery and development. The future of the field points toward increased automation, higher sensitivity with new ion sources, and the integration of high-resolution mass spectrometry for more comprehensive profiling. As therapies become more targeted, the demand for robust, specific, and ultrasensitive LC-MS/MS bioanalytical methods will only continue to grow, solidifying its central role in advancing biomedical research and personalized medicine.