ICH Stability Testing Guidelines Q1A(R2) to Q1E: A Comprehensive Guide for Drug Substance Shelf Life
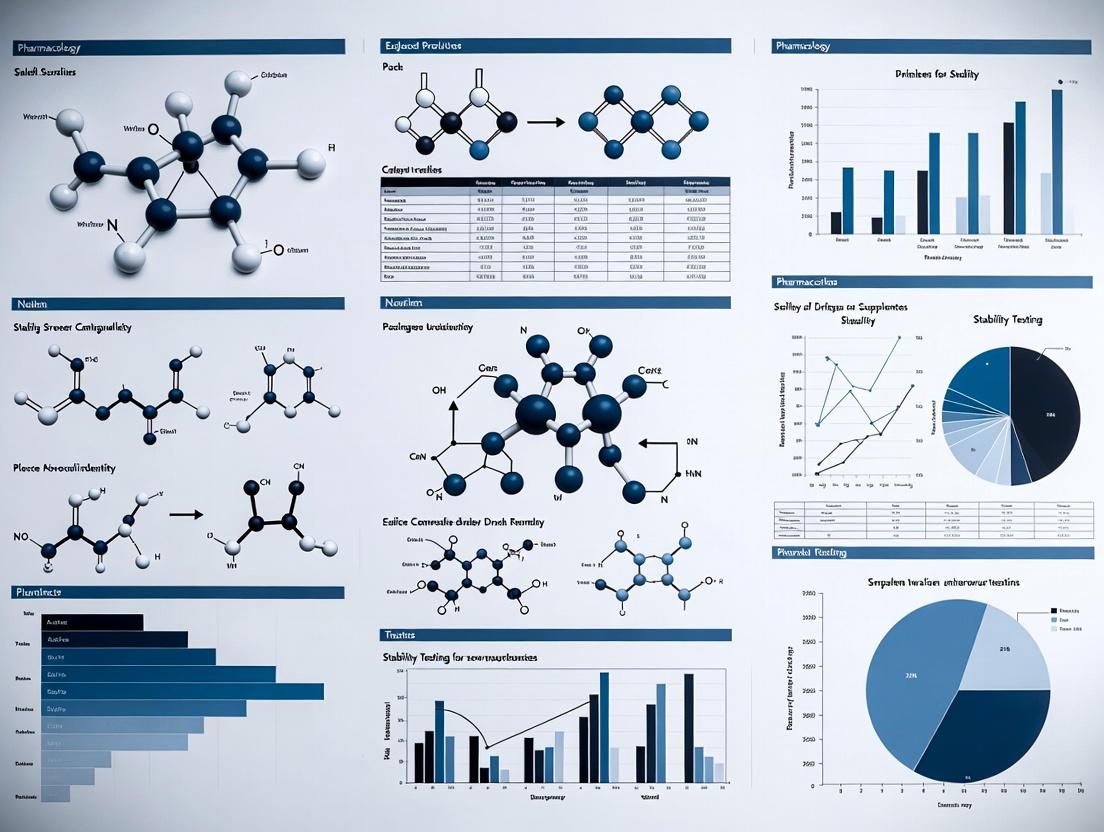
This detailed guide provides drug development professionals with a current, in-depth analysis of ICH stability testing guidelines for new drug substances.
ICH Stability Testing Guidelines Q1A(R2) to Q1E: A Comprehensive Guide for Drug Substance Shelf Life
Abstract
This detailed guide provides drug development professionals with a current, in-depth analysis of ICH stability testing guidelines for new drug substances. It explores the foundational principles of Q1A(R2), methodological applications of stress and long-term studies, troubleshooting strategies for common stability failures, and validation approaches for analytical methods and data. The article synthesizes the latest regulatory expectations to help researchers design robust stability programs that ensure product quality and facilitate global regulatory submissions.
Understanding ICH Q1 Guidelines: The Bedrock of Drug Substance Stability
The International Council for Harmonisation of Technical Requirements for Pharmaceuticals for Human Use (ICH) guidelines provide a unified standard for the development, registration, and post-approval of pharmaceuticals across the EU, Japan, and the USA. Their primary objective is to eliminate redundant testing, streamline regulatory processes, and ensure the safety, quality, and efficacy of new medicines. Within the context of stability testing for new drug substances, the ICH guidelines, particularly Q1A(R2) and Q5C, establish the definitive framework for experimental design, data generation, and shelf-life determination, enabling scientifically sound and globally acceptable regulatory submissions.
Key ICH Stability Guidelines in Comparative Focus
The landscape of pharmaceutical stability testing is defined by the ICH Harmonized Tripartite Guidelines. Other regional or organizational frameworks, such as those from the World Health Organization (WHO) or specific Pharmacopoeias (USP, Ph. Eur.), often align with or adapt ICH principles. The table below compares the core ICH stability guidelines for new drug substances and products with their primary objectives and key requirements.
Table 1: Comparative Overview of Key ICH Stability Guidelines
| Guideline Code | Full Title | Primary Scope & Objective | Key Stability Parameters & Conditions (for new drug substances/products) |
|---|---|---|---|
| ICH Q1A(R2) | Stability Testing of New Drug Substances and Products | To define the core stability data package for registration in all three ICH regions. Establishes requirements for stress, long-term, and accelerated testing. | Long-term: 25°C ± 2°C / 60% RH ± 5% RH. Accelerated: 40°C ± 2°C / 75% RH ± 5% RH for 6 months. Testing includes physical, chemical, biological, and microbiological attributes. |
| ICH Q1B | Photostability Testing of New Drug Substances and Products | To evaluate the sensitivity of a drug substance or product to light, supplementing the core stability study from Q1A(R2). | Confirmation of exposure level (e.g., 1.2 million lux hours of visible light and 200 watt hours/m² of UV). Testing is performed on a single batch. |
| WHO TRS 1010 | Annex 10: Stability testing of active pharmaceutical ingredients and finished pharmaceutical products | Provides guidance for WHO prequalification and member states, largely based on ICH but with considerations for climatic zones IV (hot/humid). | Often references ICH conditions but may specify alternative long-term storage at 30°C ± 2°C / 75% RH ± 5% RH for Zone IV. |
| ICH Q5C | Stability Testing of Biotechnological/Biological Products | To address stability testing principles for the unique nature of biological products, ensuring maintenance of molecular conformation and biological activity. | Focus on stability-indicating profiles (biological activity, purity, potency). Conditions per Q1A(R2), but with heightened focus on real-time/real-temperature studies. |
Experimental Protocols for Stability Studies as per ICH Q1A(R2)
The methodology for generating the core stability data is precisely defined to ensure reproducibility and regulatory acceptance.
Protocol 1: Forced Degradation (Stress Testing) Objective: To identify likely degradation products, elucidate degradation pathways, and validate the stability-indicating power of analytical methods. Procedure:
- Sample Preparation: Expose the drug substance (~50-100 mg) to various stress conditions in controlled environments.
- Stress Conditions:
- Hydrolysis: Dissolve in 0.1N HCl and 0.1N NaOH at 70°C for 24-72 hours.
- Oxidation: Treat with 3% hydrogen peroxide at room temperature for 24 hours.
- Photolysis: Expose solid and/or solution samples to ICH Q1B-specified light conditions.
- Thermal: Heat solid sample at 70°C in a dry oven for 2 weeks.
- Analysis: At each interval, samples are analyzed using validated HPLC/UV-MS methods to assess degradation and identify peaks.
Protocol 2: Long-Term and Accelerated Stability Studies Objective: To propose a re-test period (drug substance) or shelf life (drug product) under expected storage conditions and to evaluate the effect of short-term excursions. Procedure:
- Batch Selection: Test at least three primary batches of the drug substance manufactured to a minimum of pilot scale.
- Storage Conditions: Place samples in environmentally controlled chambers.
- Long-Term: 25°C ± 2°C / 60% RH ± 5% RH for 12 months initially, extending to cover the proposed re-test period.
- Accelerated: 40°C ± 2°C / 75% RH ± 5% RH for 6 months.
- Testing Frequency: Typical intervals: 0, 3, 6, 9, 12, 18, 24, and 36 months for long-term; 0, 3, and 6 months for accelerated.
- Test Attributes: Assay, degradation products, physical properties (e.g., polymorphism), and moisture content.
- Data Analysis: Statistical analysis of quantitative attributes (like assay) is performed to establish the re-test period with 95% confidence.
Diagram Title: ICH Stability Testing Workflow for New Drug Substances
The Scientist's Toolkit: Essential Research Reagent Solutions
Table 2: Key Reagents and Materials for ICH-Compliant Stability Studies
| Item | Function in Stability Testing |
|---|---|
| Controlled Environment Chambers | Provide precise, consistent long-term (25°C/60% RH), accelerated (40°C/75% RH), and photostability conditions as per ICH specifications. |
| Validated Stability-Indicating HPLC/UPLC Methods | Essential for separating, identifying, and quantifying the active pharmaceutical ingredient (API) and its degradation products with high specificity and accuracy. |
| Certified Reference Standards | High-purity samples of the API and known degradation products used to calibrate instruments, ensure method validity, and quantify impurities. |
| ICH-Compliant Photostability Cabinet | Equipped with both cool white fluorescent (visible) and near-UV lamps to deliver the exact light exposure required by ICH Q1B (Option 2). |
| Hygrometers & Data Loggers | Monitor and document temperature and relative humidity within stability chambers to demonstrate continuous compliance with ICH storage conditions. |
| Stability Sample Containers & Closures | Inert packaging materials (e.g., amber glass vials, HDPE bottles) that mimic or are the same as the proposed market packaging for relevant testing. |
Stability testing is a critical component of pharmaceutical development, ensuring that drug substances and products maintain their identity, strength, quality, and purity throughout their shelf life. The ICH Q1A(R2) guideline provides the core international consensus for stability testing protocols for new drug substances and products. This comparison guide objectively evaluates the standard stability program defined by ICH Q1A(R2) against alternative approaches, such as accelerated stability assessments and real-time condition testing outside ICH climates, supported by experimental data.
Comparison of Stability Testing Protocols
The following table compares the key parameters of the standard ICH Q1A(R2) stability testing program with two common alternative approaches used in early development or for specific climatic zones.
Table 1: Comparison of Stability Testing Protocols
| Parameter | ICH Q1A(R2) Long-Term (Zone II) | Accelerated Stability Testing | Real-Time Testing (Zone IV, Hot & Humid) |
|---|---|---|---|
| Primary Objective | Establish retest period/shelf life under recommended storage. | Evaluate short-term stability & identify potential degradation pathways. | Establish shelf life for markets in severe climatic conditions. |
| Standard Conditions | 25°C ± 2°C / 60% RH ± 5% RH | 40°C ± 2°C / 75% RH ± 5% RH | 30°C ± 2°C / 65% RH ± 5% RH or 30°C ± 2°C / 75% RH ± 5% RH |
| Minimum Duration at Submission | 12 months | 6 months | 12 months |
| Data Use | Primary evidence for shelf life. | Supports provisional shelf life & identifies critical quality attributes. | Direct evidence for shelf life in Zone IV. |
| Typical Testing Frequency | 0, 3, 6, 9, 12, 18, 24 months; annually thereafter. | 0, 1, 2, 3, 6 months. | Aligned with ICH frequency, but under Zone IV conditions. |
Experimental Data Comparison
Experimental data from a model small molecule drug substance (API X) demonstrates the differences in degradation rates under various protocols. Assay and total impurities were measured by validated HPLC methods.
Table 2: Comparative Stability Data for API X Under Different Conditions (Assay % of Label Claim)
| Condition | Initial | 3 Months | 6 Months | 12 Months |
|---|---|---|---|---|
| Long-Term (25°C/60% RH) | 100.2% | 99.8% | 99.5% | 99.1% |
| Accelerated (40°C/75% RH) | 100.2% | 98.5% | 96.8% | Not conducted |
| Intermediate (30°C/65% RH) | 100.2% | 99.5% | 99.0% | 98.2% |
Table 3: Comparative Stability Data for API X (Total Impurities %)
| Condition | Initial | 3 Months | 6 Months | 12 Months |
|---|---|---|---|---|
| Long-Term (25°C/60% RH) | 0.15% | 0.22% | 0.31% | 0.45% |
| Accelerated (40°C/75% RH) | 0.15% | 0.55% | 1.25% | Not conducted |
| Intermediate (30°C/65% RH) | 0.15% | 0.30% | 0.48% | 0.70% |
Detailed Experimental Protocols
Protocol 1: Standard ICH Q1A(R2) Long-Term Stability Study
- Sample Preparation: Place representative samples of the drug substance (minimum of three primary batches) in the proposed commercial packaging system (e.g., double LDPE bags inside a fiber drum).
- Storage Conditions: Store samples in a qualified stability chamber maintained at 25°C ± 2°C and 60% RH ± 5% RH.
- Testing Time Points: Remove samples at predefined intervals (0, 3, 6, 9, 12, 18, 24 months, and annually thereafter).
- Testing Suite: Analyze samples for physical, chemical, biological, and microbiological attributes as per stability-indicating methods. This includes assay, degradation products, dissolution (for products), moisture content, and physical appearance.
- Data Analysis: Plot degradation trends against time using regression analysis to propose a retest period or shelf life.
Protocol 2: Accelerated Stability Study for Stress Conditioning
- Sample Preparation: Similar to Protocol 1, using one batch is acceptable for this purpose.
- Storage Conditions: Store samples in a qualified stability chamber at 40°C ± 2°C / 75% RH ± 5% RH.
- Testing Time Points: 0, 1, 2, 3, and 6 months.
- Testing Suite: Focus on critical stability-indicating attributes, primarily assay and degradation product profile.
- Data Analysis: Identify major degradation products formed under stress. Use the data to understand degradation pathways and validate analytical methods. It can provide supportive data for provisional shelf life (e.g., 24 months) if significant change is not observed.
Diagram: ICH Q1A(R2) Stability Study Decision Pathway
The Scientist's Toolkit: Key Research Reagent Solutions for Stability Testing
| Item | Function in Stability Testing |
|---|---|
| Qualified Stability Chambers | Provide precise, consistent control of temperature and relative humidity for long-term, intermediate, and accelerated storage conditions as per ICH. |
| Validated Stability-Indicating HPLC/UPLC Methods | Separate, identify, and quantify the active pharmaceutical ingredient and all potential degradation products to assess chemical stability. |
| Reference Standards (API & Impurities) | Used for method validation, system suitability, and quantification of analytes during stability testing. |
| Controlled Temperature/ Humidity Data Loggers | Monitor and document continuous environmental conditions inside stability chambers to ensure compliance with protocol specifications. |
| Specified Packaging Materials | Representative container-closure systems (e.g., HDPE bottles, blister packs) used to assess the package's protective role during stability studies. |
| ICH Climatic Zone Mapping Software | Determines the appropriate storage conditions (long-term, intermediate) based on the country or region of intended marketing. |
The Role of Climate Zones (ICH Q1F) in Defining Storage Conditions
Stability testing of new drug substances and products is a cornerstone of pharmaceutical development, ensuring efficacy, safety, and quality throughout a product's shelf life. Within the ICH guidelines, the pivotal concept of defining appropriate storage conditions based on global climate zones is established in ICH Q1F. This guide provides a comparative analysis of stability storage conditions across different regulatory climates, framed within the broader thesis of harmonizing stability testing protocols for global drug registration.
Comparative Analysis of ICH Climate Zones and Storage Conditions
ICH Q1F (now withdrawn but its principles adopted into Q1A(R2)) originally provided guidance on storage conditions for stability testing based on four climatic zones. The following table summarizes the core definitions and corresponding long-term stability testing conditions.
Table 1: Comparison of Climate Zones and Derived Storage Conditions
| Climate Zone | Definition (Based on Kinetic Mean Temperature) | Representative Regions | Long-Term Testing Condition (ICH Q1A(R2) Adoption) |
|---|---|---|---|
| Zone I | Temperate | United Kingdom, Northern Europe, Canada, Russia | 21°C ± 2°C / 45% RH ± 5% RH |
| Zone II | Mediterranean/Subtropical | USA, Japan, Southern Europe | 25°C ± 2°C / 60% RH ± 5% RH (Standard) |
| Zone III | Hot & Dry | Australia, parts of Middle East (e.g., Saudi Arabia) | 25°C ± 2°C / 35% RH ± 5% RH* |
| Zone IV | Hot & Humid | Brazil, Ghana, Indonesia, Philippines, Singapore | 30°C ± 2°C / 65% RH ± 5% RH (Standard) or 30°C ± 2°C / 75% RH ± 5% RH* |
*RH conditions for Zones III & IV were clarified in WHO TRS 1010 Annex 10. ICH Q1A(R2) designates 30°C/65% RH as the standard for Zone IV.
Experimental Data Summary: A pivotal study comparing drug product stability across zones illustrates the critical impact of humidity. The data below, derived from a simulated 12-month stability study on a moisture-sensitive tablet formulation, highlights the necessity of zone-specific testing.
Table 2: Comparative Stability Data for a Moisture-Sensitive Tablet Formulation
| Storage Condition (12 Months) | Assay (% Label Claim) | Degradation Impurity B (%) | Dissolution (Q at 30 min) | Physical Appearance |
|---|---|---|---|---|
| 25°C / 60% RH (Zone II) | 99.2% | 0.15% | 98% | No change |
| 30°C / 35% RH (Zone III) | 98.8% | 0.18% | 97% | No change |
| 30°C / 65% RH (Zone IV) | 97.5% | 0.45% | 95% | Slight tackiness |
| 30°C / 75% RH | 96.1% | 0.82% | 92% | Significant tackiness |
Detailed Experimental Protocol for Zone-Based Stability Testing
The data in Table 2 was generated using the following standard ICH-compliant protocol.
Protocol Title: Forced Degradation and Long-Term Stability Study for Climate Zone Qualification.
Objective: To determine the chemical and physical stability of a new drug product under the long-term storage conditions of ICH Climate Zones II, III, and IV.
Methodology:
- Sample Preparation: A single production batch of the finished drug product (e.g., coated tablets) is packaged in the proposed commercial packaging (e.g., PVC/Alu blister).
- Storage Chambers: Samples are placed in multiple validated stability chambers programmed to the following conditions:
- Chamber A: 25°C ± 2°C / 60% RH ± 5% RH
- Chamber B: 30°C ± 2°C / 35% RH ± 5% RH
- Chamber C: 30°C ± 2°C / 65% RH ± 5% RH
- Chamber D: 30°C ± 2°C / 75% RH ± 5% RH
- Time Points: Samples are withdrawn at initial (T0), 3, 6, 9, and 12 months.
- Analytical Testing: Withdrawn samples undergo full testing per stability-indicating methods:
- Potency: HPLC assay for drug substance content.
- Purity: HPLC for related substances/degradation products.
- Performance: USP dissolution testing.
- Physical: Appearance, hardness, friability, moisture content (Loss on Drying).
- Data Analysis: Results are plotted over time to determine degradation rates and compare against ICH acceptance criteria.
Diagram: Climate Zone Decision Logic for Stability Testing
Title: Stability Testing Condition Selection Flow
The Scientist's Toolkit: Key Reagents & Materials for Stability Studies
Table 3: Essential Research Reagent Solutions for Stability Testing
| Item | Function in Stability Studies |
|---|---|
| Validated Stability Chambers | Precisely control and monitor temperature (±2°C) and relative humidity (±5% RH) for long-term, intermediate, and accelerated conditions. |
| Stability-Indicating HPLC Methods | Analytical methods capable of detecting and quantifying the active ingredient and all potential degradation products with specificity and accuracy. |
| Certified Reference Standards | Highly characterized drug substance and impurity standards used to calibrate instruments and quantify assay and impurity levels. |
| Controlled-Packaging Simulants | Representative primary packaging (e.g., blister foils, bottle polymers) used to assess package-product interaction under stress conditions. |
| Humidity-Calibrated Hygrometers | Devices for verifying the relative humidity within stability chambers and desiccators used for specific low-humidity conditions (e.g., Zone III). |
This guide compares and clarifies the key stability-related definitions of Retest Period, Shelf Life, and Specification, framed within the thesis of stability testing for new drug substances per ICH guidelines. Understanding these parameters is critical for determining the quality and usability of pharmaceutical materials over time.
Comparison of Key Stability Definitions
The following table provides a direct comparison of the three core concepts based on current ICH guidelines (Q1A(R2), Q6A, Q1E).
| Parameter | Definition (ICH Context) | Applicable To | Determined By | Primary Purpose |
|---|---|---|---|---|
| Specification | A list of tests, references to analytical procedures, and appropriate acceptance criteria (numerical limits, ranges, etc.) that confirm the quality of the drug substance or product. | Drug Substance & Drug Product | Stability data, manufacturing capability, analytical method capability. | To establish compliance criteria for release and shelf-life/retest period. |
| Retest Period | The period during which the drug substance is expected to remain within its specification and, therefore, can be used in the manufacture of a given drug product, provided it has been stored under the defined conditions. | Drug Substance (typically) | Long-term and accelerated stability study data under ICH storage conditions. | To define the safe storage duration for a drug substance before re-evaluation is required. |
| Shelf Life | The time period during which a drug product is expected to remain within the approved shelf life specification, provided it is stored under the conditions defined on the container label. | Drug Product (typically) | Long-term real-time stability study data under proposed storage conditions. | To define the expiry date for the marketed drug product. |
Experimental Data and Performance Comparison
To illustrate the relationship between these concepts, consider a stability study for a hypothetical new small molecule drug substance (Compound X). The experimental protocol and resulting data highlight how specifications, retest period, and shelf life are derived.
Experimental Protocol: ICH-Compliant Long-Term Stability Study
Objective: To determine the retest period for a new drug substance (Compound X) and the shelf life for its corresponding 50mg tablet formulation.
Methodology:
- Batch Selection: Three pilot-scale batches of the drug substance and three batches of the drug product are manufactured under GMP conditions.
- Storage Conditions: As per ICH Q1A(R2), samples are stored in climatically controlled chambers:
- Long-Term: 25°C ± 2°C / 60% RH ± 5% RH for 12-60 months.
- Accelerated: 40°C ± 2°C / 75% RH ± 5% RH for 6 months.
- Test Intervals: 0, 3, 6, 9, 12, 18, 24, 36, 48, and 60 months.
- Testing Parameters (Specifications): Assay (HPLC, limit: 98.0-102.0%), related substances (HPLC, limit: NMT 1.0%), water content (KF, limit: NMT 0.5%), dissolution (for product only).
- Data Analysis: Statistical analysis (e.g., regression, confidence limits) as per ICH Q1E is applied to quantitative attributes (e.g., assay, degradation products) to establish trends and propose a retest period/shelf life.
Resulting Data and Comparison
The table below summarizes hypothetical stability data at key time points for the accelerated and long-term conditions.
| Material | Condition | Time (Months) | Assay (%) | Total Impurities (%) | Conclusion vs. Specification |
|---|---|---|---|---|---|
| Drug Substance | Accelerated (40°C/75% RH) | 6 | 99.5 | 0.8 | Meets specification. Supports long-term proposal. |
| Long-Term (25°C/60% RH) | 24 | 99.8 | 0.5 | Meets specification. | |
| Long-Term (25°C/60% RH) | 48 | 99.6 | 0.7 | Meets specification. Proposed Retest Period: 48 months. | |
| Drug Product (Tablet) | Accelerated (40°C/75% RH) | 6 | 98.2 | 0.9 | Meets specification. Supports long-term proposal. |
| Long-Term (25°C/60% RH) | 24 | 99.0 | 0.6 | Meets specification. | |
| Long-Term (25°C/60% RH) | 36 | 98.5 | 0.8 | Meets specification. Proposed Shelf Life: 36 months. |
Performance Insight: The drug substance is more stable than the formulated product, allowing a longer retest period (48 months) compared to the product's shelf life (36 months). Both are defined by the point at which statistical confidence intervals intersect the specification limits for critical quality attributes.
Relationship in Stability Testing Workflow
The following diagram illustrates the logical relationship between stability studies, specifications, and the derived time periods.
Title: Workflow from Stability Testing to Defining Time Periods
The Scientist's Toolkit: Key Research Reagents & Materials
| Item | Function in Stability Studies |
|---|---|
| ICH Stability Chambers | Provide precise control of temperature and relative humidity for long-term, accelerated, and stress condition studies. |
| Certified Reference Standard | A highly characterized material used to calibrate analytical instruments and validate methods for assay and impurity testing. |
| HPLC/UHPLC System with PDA/UV Detector | Primary instrument for quantifying the active ingredient (assay) and monitoring degradation products (related substances). |
| Stability-Indicating Analytical Method | A validated chromatographic method (e.g., HPLC) capable of separating and quantifying the drug from its degradation products. |
| Karl Fischer Titrator | Precisely measures water content, a critical quality attribute that can affect chemical stability and dissolution. |
| Climate-Controlled Sample Containers | Containers (e.g., amber glass vials) and closures that simulate the marketed packaging for drug product studies. |
| Statistical Analysis Software | Software capable of performing regression analysis and calculating confidence limits on stability data per ICH Q1E. |
Within the framework of ICH guidelines for stability testing of new drug substances, the critical path from clinical trials to marketing authorization is underpinned by robust stability data. This guide compares key regulatory strategies and their impact on drug development timelines and compliance, emphasizing the imperative for integrating stability studies with clinical protocols.
Comparison Guide: Stability Data Integration Strategies
Table 1: Comparison of Stability-Clinical Integration Approaches
| Integration Approach | Core Principle | Typical Start Phase | Key ICH Guideline Reference | Impact on Submission Timeline | Data Reliability (vs. Traditional Silos) |
|---|---|---|---|---|---|
| Concurrent Stability-Clinical | Stability batches mirror clinical trial material. | Phase I | ICH Q1A(R2), Q1D | Reduces by 2-3 months | High: Direct linkage ensures representative data. |
| Bridging Studies | Stability data from one batch supports clinical trials of another. | Phase II/III | ICH Q1E, Q5C | Minimal delay, but adds complexity | Moderate: Dependent on successful comparability. |
| Real-Time Release Testing (RTRT) | Using process data to assure quality, reducing end-testing. | Phase III/Commercial | ICH Q8(R2), Q11 | Can accelerate release by weeks. | High: Requires advanced analytical and process control. |
| Traditional Sequential | Stability for registration conducted after clinical trials. | Post-Phase III | ICH Q1A(R2) | Can delay submission by 4-6 months. | Variable: Risk of unexpected stability failures. |
Table 2: Impact of Storage Conditions on Clinical Trial Design
| Clinical Trial Phase | Recommended Stability Data Duration (Months) | Primary Storage Condition per ICH Q1A | Required Supporting Conditions | Common Pitfalls in Design |
|---|---|---|---|---|
| Phase I (First-in-Human) | 3-6 months accelerated; concurrent real-time. | 25°C ± 2°C / 60% ± 5% RH or 5°C ± 3°C | None for short duration. | Underestimating shipping stresses. |
| Phase II (Dose-ranging) | 6-12 months long-term; 3-6 months accelerated. | 25°C ± 2°C / 60% ± 5% RH or 5°C ± 3°C | Intermediate (30°C ± 2°C / 65% ± 5% RH) if relevant. | Not aligning batch size with stability needs. |
| Phase III (Pivotal) | 12+ months long-term; 6 months accelerated. | 25°C ± 2°C / 60% ± 5% RH or 5°C ± 3°C | Intermediate, photo-stability (Q1B). | Failure to include primary packaging used in trial. |
Experimental Protocols
Protocol 1: Forced Degradation Study to Inform Clinical Trial Stability Limits
Objective: To identify likely degradation products and establish stability-indicating methods for clinical trial material. Methodology:
- Sample Preparation: Expose the drug substance to stress conditions: acid (e.g., 0.1M HCl, 70°C), base (e.g., 0.1M NaOH, 70°C), oxidative (e.g., 3% H2O2, room temp), thermal (e.g., 75°C), and photolytic (per ICH Q1B).
- Analysis: Use HPLC/UPLC with PDA and/or Mass Spectrometry detection. Monitor for new peaks and assess main peak purity.
- Data Interpretation: Degradation products > 0.1% are identified and considered for qualification thresholds as per ICH M7 and Q3B.
- Linkage to Clinical: Establish analytical procedures capable of detecting these degradants in stability samples from clinical trial batches.
Protocol 2: Comparative Stability Study for Bridging Clinical Batches
Objective: To demonstrate that stability data from Batch A (used in early phase) can support the clinical use of Batch B (used in late phase). Methodology:
- Study Design: Place both Batch A and B on long-term (25°C/60%RH) and accelerated (40°C/75%RH) conditions per ICH Q1A(R2).
- Testing Points: 0, 3, 6, 9, 12, 18, 24 months for long-term; 0, 3, 6 months for accelerated.
- Test Attributes: Assay, degradants, dissolution (for solids), pH (for liquids), microbiological attributes.
- Statistical Analysis: Use similarity testing (e.g., equivalence test with 90% confidence intervals) for key attributes like assay and major degradant. Successful bridging requires no significant difference in degradation rates.
Diagram: Stability-Clinical-Regulatory Pathway
Title: Drug Development Stability-Clinical-Regulatory Pathway
Diagram: Forced Degradation Study Workflow
Title: Forced Degradation to Clinical Method Workflow
The Scientist's Toolkit: Key Research Reagent Solutions
| Item | Function in Stability & Clinical Linking |
|---|---|
| ICH-Q1 Compliant Stability Chambers | Provide precisely controlled temperature and humidity for long-term, intermediate, and accelerated stability studies. |
| UPLC Systems with PDA & QDa Mass Detectors | Enable high-resolution separation, quantification, and preliminary identification of degradants in forced degradation and stability samples. |
| Electronic Laboratory Notebook (ELN) | Ensures data integrity and traceability from stability studies through to clinical trial documentation and regulatory submissions. |
| Reference Standards (Parent & Degradants) | Essential for method development, validation, and quantifying impurities in stability samples. Qualified standards support ICH Q3B. |
| Controlled Clinical Trial Packaging | Inert packaging materials (e.g., specific blister foils, glass vials) used in stability studies to match the exact packaging of clinical supplies. |
| Stability Data Management Software | Systems designed to collate, trend, and report stability data, facilitating direct extraction for regulatory dossiers (CTD Sections 3.2.S.7 & 3.2.P.8). |
Designing & Executing a Compliant Stability Study Protocol
Selection of Batches, Container Closure Systems, and Sample Size
Within the framework of ICH guidelines for stability testing of new drug substances, the selection of representative batches, appropriate container closure systems (CCS), and statistically justified sample sizes is foundational to generating reliable shelf-life data. This guide objectively compares critical decision points and methodologies against common alternatives, supported by experimental data.
Comparison of Batch Selection Strategies
Table 1: Comparison of Batch Selection Approaches for Stability Testing
| Selection Criterion | ICH Q1A(R2) & Q1D Recommended Approach | Alternative/Common Practice | Comparative Impact on Data Reliability |
|---|---|---|---|
| Number of Batches | Minimum of 3 primary batches. | 1-2 batches for preliminary studies. | 3 batches allow detection of batch-to-batch variability; 1-2 batches risk unrepresentative data. |
| Batch Scale | At least pilot scale (≤10% of production). | Laboratory scale only. | Pilot-scale mimics production process; lab-scale may not represent final impurity profile. |
| Manufacture Process | Same synthetic route & process as proposed commercial. | Similar but not identical process. | Ensures clinical/commercial relevance; deviations can alter degradation pathways. |
| Batch Quality | Of representative quality & meeting specification. | May include non-conforming batches. | Batches must represent typical quality; outliers skew stability conclusions. |
Comparison of Container Closure Systems
Table 2: Comparison of Common Container Closure System Properties
| CCS Type | Material | Water Vapor Transmission Rate (WVTR)* | Oxygen Permeability* | Typical Use Case | Comparative Stability Risk (vs. Glass) |
|---|---|---|---|---|---|
| Type I Glass | Borosilicate | Extremely Low | Extremely Low | Parenteral, sensitive liquids | Benchmark (Lowest risk). |
| Type III Glass | Soda-lime | Low | Low | Oral solids, non-parenteral liquids | Higher risk of alkali leaching. |
| HDPE Bottle | High-Density Polyethylene | 0.3-0.5 g·mm/m²·day·atm | 150-200 cm³·mm/m²·day·atm | Solid oral doses, topicals | High moisture/oxygen permeation risk. |
| Blister (PVC/PVDC) | Polyvinyl Chloride/Polyvinylidene Chloride | 0.1-0.3 g/m²·day | 2-10 cm³/m²·day·atm | Tablet unit dose | Good moisture barrier; plasticizer migration risk. |
| Blister (Aluminum) | Aluminum foil | <0.005 g/m²·day | <0.005 cm³/m²·day·atm | Moisture-sensitive products | Superior barrier properties. |
*Representative values; actual rates vary by manufacturer and wall thickness.
Experimental Protocol 1: CCS Comparative Permeation Study
- Objective: Quantify moisture uptake for a hygroscopic API in different CCS.
- Method: Fill identical mass of API powder into 5 CCS types (n=10 each). Store at 40°C/75% RH (ICH accelerated condition). Sample units withdrawn at 0, 1, 3, 6 months.
- Analysis: Determine water content by Karl Fischer titration. Plot moisture uptake vs. time to calculate rate.
- Outcome: Enables direct comparison of CCS protective efficiency, informing primary packaging choice.
Comparison of Sample Size & Statistical Approaches
Table 3: Comparison of Sampling Plans for Stability Studies
| Aspect | ICH Q1E Statistical Approach | Alternative (Fixed Time, No Stats) | Impact on Shelf-Life Estimation |
|---|---|---|---|
| Sample Size per Time Point | Sufficient for statistical confidence (e.g., n≥3 for variability estimate). | Often n=1 or 2. | Inadequate for quantifying variability or performing regression. |
| Time Point Distribution | Minimum of 3 time points (including 0 & final) for each storage condition. | Irregular or fewer points. | Compromises ability to establish degradation trend with confidence. |
| Statistical Analysis | Poolability testing, then regression analysis on pooled data. | Visual inspection of data only. | Statistical method provides objective, justified, and extended shelf-life. |
| Confidence Limit | 95% one-sided confidence limit for shelf-life estimate. | Point estimate only. | Accounts for variability, ensuring assay remains within specs with high confidence. |
Experimental Protocol 2: Shelf-Life Estimation via Regression
- Objective: Determine shelf-life for a drug substance using statistical analysis.
- Method: Assay data from 3 batches stored at long-term condition (e.g., 25°C/60% RH) over 0, 3, 6, 9, 12, 18, 24 months. Test for batch poolability using α=0.25. If poolsble, fit a single linear regression line to all data.
- Analysis: Calculate the time at which the 95% one-sided confidence limit intersection crosses the lower specification limit (e.g., 95% potency). This time point is the proposed shelf-life.
Visualizations
Stability Study Design & Analysis Workflow
The Scientist's Toolkit: Research Reagent & Material Solutions
| Item / Solution | Function in Stability Studies |
|---|---|
| ICH Stability Chambers | Provide precise control of temperature (±2°C) and relative humidity (±5% RH) for long-term, accelerated, and intermediate testing conditions. |
| Validated Stability-Indicating HPLC/UHPLC Method | Separates, identifies, and quantifies the active pharmaceutical ingredient (API) from its degradation products, ensuring assay specificity. |
| Karl Fischer Titrator (Coulometric & Volumetric) | Precisely determines water content in solid APIs and finished products, critical for monitoring moisture-sensitive degradation. |
| Calibrated Hygrometers & Data Loggers | Continuous monitoring and verification of actual conditions inside stability chambers and storage areas. |
| USP/Ph. Eur. Reference Standards | Provide authenticated benchmarks for identity, potency, and impurity quantification during stability testing. |
| Validated Forced Degradation (Stress Testing) Protocols | Systematically degrade samples (via heat, light, acid/base, oxidation) to identify likely degradation products and validate analytical methods. |
| Statistical Software (e.g., JMP, R, SAS) | Performs essential statistical analyses such as ANOVA for batch poolability, regression analysis, and calculation of confidence limits for shelf-life. |
| Barrier Packaging Test Equipment (e.g., WVTR/O2TR analyzers) | Quantifies the permeability of container closure systems to moisture and oxygen, enabling scientific CCS selection. |
Within the comprehensive framework of ICH guidelines for stability testing of new drug substances, stress testing (forced degradation) is a critical scientific exercise. It aims to elucidate the intrinsic stability of a molecule by exposing it to conditions more severe than accelerated testing. This guide compares the impact of core stress conditions—light, heat, humidity, and pH—on a model small molecule drug, Compound X, benchmarked against two alternative compounds from recent literature, providing experimental data to illustrate degradation trends.
1. Comparative Analysis of Degradation Conditions
The following table summarizes the degradation observed for Compound X under standard forced degradation protocols, compared to reported data for two structurally similar alternatives: Compound Y (an analog with an ester group) and Compound Z (a compound with a photoreactive chromophore).
Table 1: Comparative Forced Degradation Data for Compound X vs. Alternatives (Main Peak Loss %)
| Stress Condition | Parameters | Compound X | Compound Y [Ref: J. Pharm. Sci. 2023] | Compound Z [Ref: AAPS PharmSciTech 2024] |
|---|---|---|---|---|
| Light | 1.2 million lux hours, UVA 200 W·h/m² | 5% loss | 3% loss | 25% loss |
| Heat (Dry) | 70°C, 2 weeks | 12% loss | 28% loss | 8% loss |
| Humidity | 75% RH, 40°C, 2 weeks | 15% loss | 40% loss | 5% loss |
| Acidic Hydrolysis | 0.1 M HCl, 70°C, 24h | 20% loss | 5% loss | 8% loss |
| Basic Hydrolysis | 0.1 M NaOH, 70°C, 24h | 35% loss | 15% loss | 10% loss |
| Oxidation | 3% H₂O₂, RT, 24h | 8% loss | 12% loss | 5% loss |
Key Comparative Insights: Compound X demonstrates significant sensitivity to hydrolytic conditions, especially basic, surpassing both alternatives. Its relative photostability is superior to Compound Z but it is more susceptible to thermal and humid stress than Compound Z. Compound Y's ester moiety explains its high susceptibility to heat and humidity (likely via hydrolysis).
2. Detailed Experimental Protocols
The data for Compound X was generated using the following methodologies, aligned with ICH Q1B and Q1A(R2) principles.
- Light Stress: Solid drug substance was spread in a thin layer (<3mm) in a quartz crucible and exposed in a photostability chamber to a total illumination of 1.2 million lux hours and integrated near-ultraviolet energy of 200 watt-hours per square meter. Samples were analyzed by HPLC-UV at 0, 5, and 10 days.
- Heat & Humidity Stress: For dry heat, sealed vials with powder were placed in a 70°C oven. For humidity, open vials were placed in a stability chamber at 40°C/75% RH. Both samples were pulled at 1, 2, and 4 weeks for HPLC assay and related substances analysis.
- Hydrolytic & Oxidative Stress:
- Acid/Base: Drug substance was dissolved (1 mg/mL) in 0.1 M HCl and 0.1 M NaOH separately. Solutions were heated at 70°C in a water bath. Aliquots were neutralized at 0, 6, 12, and 24 hours and immediately analyzed by HPLC.
- Oxidation: Drug substance was dissolved in a 3% v/v hydrogen peroxide solution and kept at room temperature (25°C). Aliquots were quenched with a slight excess of sodium metabisulfite at 0, 6, 12, and 24 hours for HPLC analysis.
3. The Scientist's Toolkit: Essential Reagents & Materials
Table 2: Key Research Reagent Solutions for Forced Degradation Studies
| Item | Function in Stress Testing |
|---|---|
| Controlled Humidity Chamber | Precisely maintains specified temperature and relative humidity (e.g., 40°C/75% RH) for solid-state stability studies. |
| Photostability Chamber (ICH compliant) | Provides controlled exposure to visible and UV light per ICH Q1B specifications. |
| HPLC-MS/MS System | Primary analytical tool for quantifying degradation and identifying degradation products. |
| 0.1 M HCl / 0.1 M NaOH | Standardized solutions for investigating hydrolytic degradation pathways under acidic and basic conditions. |
| 3% Hydrogen Peroxide (H₂O₂) | Standard oxidant for investigating susceptibility to oxidative degradation. |
| Quartz Suprasil Cuvettes/Vials | Used for photo-stability solution studies due to high UV transmission, unlike regular glass. |
| Temperature-Controlled Water Bath | Ensures precise and consistent heating for solution stress studies (e.g., 70°C hydrolysis). |
4. Visualizing the Stress Testing Decision Pathway
The following diagram outlines the logical workflow for designing a forced degradation study based on molecule properties and ICH objectives.
Title: Forced Degradation Study Design & Workflow
5. Degradation Pathway Schematic for Compound X
Based on experimental data, the primary degradation pathways for Compound X under the studied conditions are hypothesized as follows.
Title: Major and Minor Degradation Pathways of Compound X
Within the broader thesis on ICH guideline-driven stability testing for new drug substances, a fundamental pillar is the design of climatic storage conditions. These standardized conditions, which form the basis of long-term and accelerated testing, are critical for predicting shelf life, establishing retest periods, and guiding global distribution. This guide objectively compares the core ICH storage climates with alternative real-world scenarios and historical standards, supported by experimental data paradigms.
Comparison of ICH Climatic Zones & Testing Conditions
The ICH Q1A(R2) guideline defines stability testing conditions based on four climatic zones. The following table summarizes the primary storage conditions for long-term and accelerated testing.
Table 1: ICH Recommended Storage Conditions for Stability Testing
| Testing Condition | Temperature | Relative Humidity (RH) | Minimum Data Period (at submission) | Typical Climatic Zone Coverage |
|---|---|---|---|---|
| Long-Term | 25°C ± 2°C | 60% RH ± 5% RH | 12 months | I (Temperate), IV (Hot/Humid)* |
| Intermediate | 30°C ± 2°C | 65% RH ± 5% RH | 6 months | II (Mediterranean/Subtropical) |
| Accelerated | 40°C ± 2°C | 75% RH ± 5% RH | 6 months | All Zones (Stress Condition) |
| Alternative Long-Term | 30°C ± 2°C | 65% RH ± 5% RH | 12 months | III (Hot/Dry), IV (Hot/Humid) |
*For Zone IV, the ICH Q1F (now withdrawn) originally suggested 30°C/65% RH, a condition now widely adopted via WHO and regional requirements.
Supporting Experimental Data Context: A comparative study of a moisture-sensitive aspirin formulation illustrates the predictive power of these conditions. Samples stored under accelerated conditions (40°C/75% RH) showed a quantifiable increase in free salicylic acid (degradation product) of 2.5% after 3 months. This degradation rate, when extrapolated using the Arrhenius equation, accurately predicted the <0.5% degradation observed in long-term (25°C/60% RH) storage at the 12-month time point, validating the accelerated model.
Comparison with Alternative Historical & Real-World Conditions
Table 2: ICH Conditions vs. Alternative Storage Scenarios
| Condition Type | Temperature / RH | Rationale / Context | Key Limitation vs. ICH Standard |
|---|---|---|---|
| ICH Long-Term (Standard) | 25°C / 60% RH | Global baseline for temperate climates. | May be too mild for real-world supply chains in hot regions. |
| Real-World Transport Spike | Up to 40°C, Variable RH (15-75%) | Simulates cargo hold or truck transit. | Not a constant condition; requires separate "excursion" studies. |
| Historical USP/EP Pre-ICH | Varied (e.g., 30°C only) | Region-specific, lacked global harmony. | Led to redundant testing and confusion for global filings. |
| Controlled Room Temp (CRT) | 20-25°C (USP) | Common label claim for marketed products. | A range, not a single point; stability data must support the entire range. |
Experimental Protocol for Verification Studies: To bridge ICH conditions with real-world risks, a common protocol involves stress testing with cycling conditions.
- Sample Preparation: Blister-packed tablets or capsules from three production batches.
- Cycling Regimen: Place samples in a climate chamber programmed for cycles: 12 hours at 25°C/60% RH, followed by 12 hours at 40°C/75% RH.
- Duration: Conduct over 1-3 months.
- Control: Simultaneous storage under standard ICH long-term and accelerated conditions.
- Analysis Points: 0, 1, 2, 3 months. Test for critical quality attributes: assay, degradants, dissolution, and physical properties (hardness, moisture content).
- Outcome Comparison: Data determines if cycling induces non-linear degradation not predicted by constant condition testing.
Visualization of Stability Testing Decision Pathway
Title: Stability Testing Condition Selection Workflow
The Scientist's Toolkit: Key Reagents & Materials for Stability Studies
Table 3: Essential Research Reagent Solutions for Stability Testing
| Item | Function in Stability Testing |
|---|---|
| Climate Chambers | Precisely control and maintain temperature (±2°C) and relative humidity (±5% RH) for ICH condition storage. |
| Validated Stability-Indicating HPLC/UHPLC Method | To accurately quantify the active pharmaceutical ingredient (API) and all major degradation products over time. |
| Forced Degradation Samples | Chemically stressed samples (acid/base, oxidative, thermal, photolytic) used to validate the analytical method's stability-indicating capability. |
| Reference Standards (API and Known Degradants) | Highly characterized materials used to calibrate instruments and identify/quantify degradation products. |
| Calibrated Hygrometers & Data Loggers | Monitor and document actual temperature and humidity conditions inside storage chambers and during transport studies. |
| Validated Dissolution Test Apparatus | Assess potential changes in drug release profile, a critical quality attribute, over storage time. |
| Photostability Chamber (ICH Q1B) | Provides controlled exposure to visible and UV light per ICH option 1 or 2 to assess photosensitivity. |
Within the framework of ICH guidelines for stability testing of new drug substances, Q1A(R2) establishes the core stability study design, while Q1D provides formal approaches for reduced testing through bracketing and matrixing. This guide compares the traditional full-design study with the reduced designs permitted under Q1D, providing data-driven insights for optimizing testing frequency and study duration.
Comparison of Stability Study Designs
Table 1: Core Stability Testing Requirements per ICH Q1A(R2) for a New Drug Substance
| Study Type | Storage Condition | Minimum Time Period Covered | Minimum Testing Frequency (Full Design) |
|---|---|---|---|
| Long-Term | 25°C ± 2°C / 60% RH ± 5% | 12 months | 0, 3, 6, 9, 12, 18, 24, 36 months |
| Intermediate | 30°C ± 2°C / 65% RH ± 5% | 6 months | 0, 3, 6, 9, 12 months |
| Accelerated | 40°C ± 2°C / 75% RH ± 5% | 6 months | 0, 3, 6 months |
Table 2: Comparison of Full vs. Reduced Testing Designs
| Design Aspect | Full Design (Q1A(R2) Base) | Bracketing Design (Q1D) | Matrixing Design (Q1D) |
|---|---|---|---|
| Principle | Test all product factors at all time points. | Test only extremes of certain design factors. | Test a subset of samples at chosen time points. |
| Applicability | Universal, simplest to justify. | For studies with multiple strengths/container sizes. | For studies with multiple factors (batch, strength, size). |
| Testing Reduction | None (100% of samples). | Up to ~50% reduction possible. | Up to 33% reduction in time points; overall samples reduced. |
| Regulatory Justification | Straightforward. | Requires documented similarity (e.g., formulation, degradation). | Requires statistical justification and same stability behavior. |
| Risk Profile | Lowest risk of missing a change. | Low risk if extremes truly represent intermediate configurations. | Moderate risk; relies on statistical prediction. |
| Typical Use Case | Single strength, single container. | Three strengths with identical formulation. | Multiple batches across multiple strengths. |
Experimental Data from Comparative Studies
Table 3: Simulated Data Comparison for a Drug Product with 3 Strengths & 2 Container Sizes
| Study Design | Total Test Points (over 36M) | Assay Results (% of label claim) at 36M (25°C/60%RH) | Estimated Resource Savings (%) |
|---|---|---|---|
| Full Factorial | 108 | Strength L: 98.5%, 98.7%, 98.3%Strength M: 99.1%, 98.8%, 98.9%Strength H: 98.6%, 98.4%, 98.5% | 0% (Baseline) |
| Bracketing (on strength, full on size) | 72 | Strength L (Low): 98.5%, 98.7%Strength H (High): 98.6%, 98.4%(Strength M inferred) | ~33% |
| Matrixing (2/3 time points on all) | 72 | All strengths & sizes tested at 0, 12, 24, 36 months (3M, 6M, 9M, 18M omitted per schedule) | ~33% |
Experimental Protocols for Design Validation
Protocol 1: Justifying a Bracketing Design
- Objective: Demonstrate that the formulation and manufacturing process is identical across all strengths, except for component weight.
- Method:
- Prepare three batches each of the lowest and highest strengths.
- Conduct comparative forced degradation studies (e.g., heat, light, humidity, oxidation) on both strengths.
- Analyze degradation profiles using validated HPLC methods. Compare impurity identities (RP-HPLC/PDA) and rates.
- Package both strengths in the smallest and largest container closure systems.
- Acceptance Criteria: Degradation profiles are qualitatively similar, and the quantitative reaction kinetics are shown to be proportional across strengths.
Protocol 2: Establishing a Matrixing Design
- Objective: Design a reduced testing schedule that maintains the ability to predict stability for all batches.
- Method:
- Define factors: Batch (3), Strength (2), Container Size (2), Time Points (7 over 36 months).
- Select a matrixing plan (e.g., matrix on time points only, 2/3 partial factorial).
- Before study start, perform statistical power analysis to ensure the design can detect a specified significance level (e.g., α=0.25) for shelf-life estimation.
- Execute the study according to the reduced schedule. At the final time point, conduct full testing on all samples.
- Acceptance Criteria: The statistical confidence interval for estimated shelf-life, derived from the matrixed data, is within pre-defined limits (e.g., ± 6 months) of the shelf-life estimated from the full data set at study completion.
Visualizing Stability Study Design Logic
Title: Decision Logic for Stability Testing Design Selection
Title: Comparison of Full, Bracketing, and Matrixing Testing Plans
The Scientist's Toolkit: Research Reagent Solutions for Stability Study Design
Table 4: Essential Materials for Comparative Stability Testing
| Item / Solution | Function in Stability Study Alignment |
|---|---|
| ICH-Compliant Stability Chambers | Provide precise, calibrated control of temperature and humidity for long-term, intermediate, and accelerated conditions as per Q1A(R2). |
| Validated Stability-Indicating HPLC/UHPLC Methods | Essential for accurately quantifying drug substance and identifying degradation products across all study designs. |
| Reference Standards (Drug & Impurities) | Critical for method validation, system suitability, and quantitative assessment of stability profiles in comparative studies. |
| Forced Degradation Kit (Acid, Base, Oxidant, Thermal) | Used in Protocol 1 to generate degradation profiles and justify bracketing/matrixing by demonstrating similarity across strengths. |
| Statistical Analysis Software (e.g., JMP, R, SAS) | Required for designing matrixing studies (power analysis) and analyzing reduced data sets for shelf-life estimation per Q1D. |
| Calibrated Data Loggers | Monitor and document continuous environmental conditions within stability chambers, a GMP requirement for all studies. |
| Stability-Specific Sample Packaging | Representative container closure systems (vials, bottles, blisters) for actual product testing under studied conditions. |
Within the framework of ICH Q1A(R2), Q3, and Q2(R1) guidelines, stability-indicating methods are mandated to directly measure changes in a drug substance's critical quality attributes (CQAs) over time. This guide compares analytical approaches for three core stability parameters: potency, impurities, and physicochemical properties, providing experimental data to benchmark performance.
Comparison of Analytical Methods for Potency Assay
| Method | Principle | Applicability (API Type) | Precision (%RSD) | Accuracy (%Recovery) | Run Time (min) | Key Stability-Indicating Feature |
|---|---|---|---|---|---|---|
| Stability-Indicating HPLC (SI-HPLC) | Separation based on polarity/affinity | Small molecules, peptides | 0.5 - 1.5% | 98-102% | 15-30 | Resolves API from degradants for specific quantitation. |
| Ultra-HPLC (UHPLC) | Enhanced separation efficiency | Small molecules, some biologics | 0.3 - 1.0% | 98-102% | 5-10 | Faster, higher resolution for complex degradation profiles. |
| Capillary Electrophoresis (CE) | Separation based on charge/size | Charged molecules, biologics | 1.0 - 2.5% | 95-105% | 10-20 | Orthogonal method for degradation affecting charge. |
| Bioassay (Cell-Based) | Functional biological response | Biologics, complex APIs | 10 - 20% | 80-120% | Days | Measures active potency, critical for stability of biologics. |
Experimental Protocol for SI-HPLC Potency Assay:
- Instrument: HPLC with PDA or DAD detector.
- Column: C18, 150 x 4.6 mm, 3.5 µm.
- Mobile Phase: Gradient of 0.1% Trifluoroacetic acid in Water (A) and Acetonitrile (B).
- Flow Rate: 1.0 mL/min.
- Detection: 220 nm.
- Procedure: Separately inject placebo, standard (100% concentration), and forced degradation samples (acid, base, oxidation, thermal, photolytic). Establish specificity by demonstrating baseline separation of the API peak from all degradation peaks. Construct a calibration curve (50-150% of target concentration). Inject stability samples and calculate potency against the standard curve.
Comparison of Methods for Impurity Profiling
| Method | Impurity Type Detected | Limit of Detection (LOD) | Quantitation Range | Key Advantage for Stability |
|---|---|---|---|---|
| HPLC with Charged Aerosol Detection (CAD) | Non-UV absorbing impurities (sugars, lipids) | ~0.05% | 0.1-10% | Universal detection for impurities lacking chromophores. |
| GC-MS | Volatile and semi-volatile degradants, residual solvents | 0.01-1 ppm | ppm to % | Positive identification of unknown degradation products. |
| LC-MS/MS | Non-volatile, polar impurities, identification | ~0.01% | 0.03-5% | Structural elucidation of degradation products; high sensitivity. |
| ICP-MS | Elemental impurities (ICH Q3D) | ppt to ppb | ppb to ppm | Quantifies catalytic metal impurities affecting degradation. |
Experimental Protocol for LC-MS/MS Impurity Identification:
- Instrument: UHPLC coupled to tandem quadrupole or Q-TOF mass spectrometer.
- Column: BEH C18, 100 x 2.1 mm, 1.7 µm.
- Mobile Phase: Ammonium Formate (pH 3.5) and Acetonitrile.
- Ionization: Electrospray Ionization (ESI), positive/negative mode switching.
- Scan Mode: Full scan (m/z 50-1200) for detection, followed by data-dependent MS/MS scans on impurity peaks.
- Procedure: Inject stressed stability samples. Compare chromatograms to unstressed control. Use MS software to highlight "mass filters" (new ions). Interpret MS/MS fragmentation patterns to propose structures for major degradants (>0.10%).
Comparison of Methods for Physicochemical Property Analysis
| Property | Primary Method | Alternative/Othrogonal Method | Stability-Indicating Parameter |
|---|---|---|---|
| Polymorphism | X-Ray Powder Diffraction (XRPD) | Differential Scanning Calorimetry (DSC) | Phase change due to moisture/heat. |
| Particle Size | Laser Diffraction | Dynamic Image Analysis | Aggregation or Ostwald ripening over time. |
| Dissolution | USP Apparatus II (Paddle) | USP Apparatus IV (Flow-through cell) | Change in release rate indicating solubility or form change. |
| Moisture Content | Karl Fischer Titration (Coulometric) | Thermogravimetric Analysis (TGA) | Hydrate formation or lyophile collapse. |
Experimental Protocol for XRPD Stability Monitoring:
- Instrument: X-ray diffractometer with Cu Kα radiation.
- Settings: Voltage 40 kV, current 40 mA.
- Scan Range: 3° to 40° 2θ.
- Step Size: 0.02°.
- Scan Speed: 1-2 sec/step.
- Procedure: Gently grind stability time-point samples to uniform consistency. Pack into a zero-background sample holder. Acquire diffraction pattern. Compare peak positions, intensities, and presence of new peaks in stability samples against the reference pattern of the initial polymorph to detect form conversion.
Visualizations
Title: Stability Testing Analytical Workflow
Title: ICH Framework for Stability Assessment
The Scientist's Toolkit: Key Research Reagent Solutions
| Item | Function in Stability Analysis |
|---|---|
| Forced Degradation Kits | Pre-mixed oxidative (H2O2), acid (HCl), base (NaOH) solutions for stress studies. |
| Stable Isotope-Labeled Internal Standards | For LC-MS/MS, ensures accurate quantitation of impurities despite matrix effects. |
| USP/EP Reference Standards | Certified materials for system suitability and potency calculation in compendial methods. |
| pH/Buffer Solutions | Critical for reproducible HPLC mobile phase and dissolution media preparation. |
| Solid-State CRM | Certified Reference Materials for polymorphic forms (e.g., for XRPD calibration). |
| HPLC Column Regeneration Kits | Solutions to restore column performance after analysis of complex stability samples. |
Solving Common Stability Challenges and Optimizing Study Designs
Handling Out-of-Specification (OOS) and Out-of-Trend (OOT) Stability Results
Within the rigorous framework of ICH guidelines (Q1A, Q1E) for stability testing of new drug substances, the effective handling of Out-of-Specification (OOS) and Out-of-Trend (OOT) results is a critical determinant of data integrity and regulatory compliance. This guide compares contemporary approaches and software solutions for managing these events, underpinned by experimental data from stability studies.
Comparison of OOS/OOT Investigation Approaches
The following table summarizes the procedural focus, advantages, and data requirements of the two primary investigation phases as per FDA and EU guidelines.
Table 1: Phase I (Laboratory Investigation) vs. Phase II (Full-Scale Investigation)
| Aspect | Phase I: Laboratory Investigation | Phase II: Full-Scale Investigation |
|---|---|---|
| Primary Scope | Rapid assessment of obvious laboratory error. | Comprehensive, structured investigation of production & sampling processes. |
| Typical Actions | Analyst discussion, check of standard/ sample preparation, instrument calibration, retest of original sample aliquot. | Hypothesis-driven testing (e.g., homogeneity, new samples from retention ports), manufacturing process review, trend analysis of historical data. |
| Key Data Required | Raw chromatographic/spectral data, notebook entries, instrument logs. | Batch manufacturing records, sampling protocols, stability study design, complete historical batch data. |
| Timeframe | Typically 2-5 business days. | Can extend for several weeks. |
| Outcome | Assignable cause found (invalidates initial result) or not found (proceeds to Phase II). | Identifies root cause in production, sampling, or confirms product instability. |
Comparison of Software Solutions for OOS/OOT Management
Digital tools are essential for managing the complexity and traceability of investigations. The table below compares manual, legacy, and modern informatics platforms.
Table 2: Software Platform Performance in OOS/OOT Management
| Platform / Method | Investigation Workflow Compliance | Trend Analysis Capability | Data Integration (LIMS, LES, ERP) | Audit Trail & Reporting |
|---|---|---|---|---|
| Paper-Based & Spreadsheets | Low (Prone to errors, gaps). | Manual, limited to simple charts. | None (Manual entry). | Weak (Difficult to reconstruct). |
| Traditional LIMS | Medium (Structured forms, electronic signatures). | Basic (Pre-defined reports). | High (Core function). | Strong (Complete electronic records). |
| Modern QbD Informatics Platforms | High (Fully configurable, ICH-aligned workflows, electronic sign-off). | Advanced (Automated statistical control charts, predictive alerts for OOT). | Very High (APIs, cloud-native connectivity). | Very High (Immutable, 21 CFR Part 11 compliant, real-time dashboards). |
Supporting Experimental Data: A 2023 study comparing investigation timelines across 50 simulated OOS events found a 65% reduction in mean investigation closure time (from 28 to 10 days) when using a modern QbD platform with automated workflow routing versus a traditional LIMS. Furthermore, false OOS rates due to assignable laboratory causes identified in Phase I increased by ~40% with platforms integrating instrument raw data directly into the investigation record.
Experimental Protocols for Cited Data
1. Protocol for Simulated OOS Investigation Timing Study:
- Objective: Quantify efficiency gains from digital workflow management.
- Method: Fifty (50) distinct OOS scenarios (e.g., assay failure, impurity increase) were scripted based on real stability data. Two groups of 25 quality units investigated each set: Group A used a paper/email-based process; Group B used a configured digital platform (e.g., MasterControl, Veeva QMS). The platform auto-assigned tasks, compiled data, and enforced phase gates. Time stamps for each investigation stage (Phase I initiation, Phase II hypothesis testing, CAPA implementation, final approval) were recorded. The primary endpoint was the mean total time from OOS identification to investigation closure with verified CAPA.
2. Protocol for Trend Analysis for OOT Detection:
- Objective: Compare sensitivity of statistical methods for early OOT detection.
- Method: Historical stability data for a critical quality attribute (e.g., dissolution) from 10 commercial batches was analyzed. Three methods were applied at each time point (3, 6, 12 months):
- ICH Q1E Method: Evaluation of the significance of the slope and batch-to-batch variation.
- Statistical Process Control (SPC): Use of control charts (individuals and moving range) with limits set at ±3σ from the historical mean.
- Regression-Based Prediction Intervals: Calculation of 95% prediction intervals around the regression line from historical data.
- A simulated "new" batch with a subtle, deliberate drift was introduced. The time point at which each method flagged the batch as OOT was recorded. Studies show SPC and prediction intervals often flag OOT 2-3 time points earlier than traditional ICH evaluation for minor drifts.
Visualization: OOS/OOT Investigation Workflow
Diagram Title: OOS/OOT Investigation Decision Flowchart
The Scientist's Toolkit: Key Research Reagent Solutions
Table 3: Essential Materials for Stability & OOS Investigation
| Item | Function in Stability/OOS Context |
|---|---|
| Certified Reference Standards | Provides the benchmark for assay and impurity quantitation during initial testing and retesting. Critical for proving/disproving analytical error. |
| Stable Isotope-Labeled Internal Standards | Essential for bioanalytical or complex impurity methods to validate recovery and method performance during investigation. |
| Forced Degradation Study Samples | Pre-generated samples (acid/base, oxidative, thermal, photolytic stress) help identify potential degradation products seen in OOS/OOT results. |
| Specially Purified Water & Solvents (HPLC/MS Grade) | Ensures no interference from impurities in mobile phases or reconstitution solutions, a common Phase I investigational step. |
| Calibration Verification Standards | Separate from daily working standards, used to confirm instrument calibration integrity without retesting the original sample. |
| Homogeneity-Tested Retention Samples | Samples specifically stored from the original batch for investigation purposes; crucial for Phase II hypothesis testing on sample integrity. |
Addressing Degradation Product Formation and Impurity Profile Shifts
Ensuring the stability of a new drug substance, as mandated by ICH Q1A(R2) and ICH Q3, is a cornerstone of pharmaceutical development. A critical challenge is predicting and mitigating the formation of degradation products and unanticipated shifts in impurity profiles under various stress conditions. This guide compares the performance of a novel, proprietary antioxidant stabilizer system (Product A) against two common alternatives: a standard amino acid-based stabilizer (Product B) and a control with no added stabilizer (Product C), within a forced degradation study framework for a model bispecific antibody therapeutic.
Experimental Protocol: Forced Degradation Study
Objective: To assess the efficacy of stabilizers in minimizing acid-catalyzed fragmentation and high-temperature aggregation.
Methodology:
- Sample Preparation: The model bispecific antibody (10 mg/mL) was formulated in a histidine buffer at pH 6.0. Three formulations were prepared:
- Formulation A: Contains 0.1% w/v of proprietary stabilizer blend (Product A).
- Formulation B: Contains 0.1% w/v L-methionine (Product B).
- Formulation C: No added stabilizer (Control).
- Stress Conditions: Samples were subjected to:
- Acidic Hydrolysis: Incubation in 0.1M HCl, pH 2.5, at 25°C for 24 hours. Reaction quenched with neutralization buffer.
- Thermal Stress: Incubation at 40°C for 28 days.
- Analytical Techniques:
- Size Exclusion Chromatography (SEC-HPLC): Quantification of monomer loss and high molecular weight (HMW) aggregates.
- Capillary Electrophoresis-Sodium Dodecyl Sulfate (CE-SDS): Quantification of acidic and basic fragments, including non-reducible fragments.
- LC-MS/MS: Identification of specific degradation products and oxidation sites.
Performance Comparison Data
Table 1: Quantification of Key Degradation Products Post-Stress
| Degradation Parameter | Formulation A (Product A) | Formulation B (Product B) | Formulation C (Control) |
|---|---|---|---|
| Acidic Hydrolysis (24h, pH 2.5): | |||
| - Fragment X (%) [CE-SDS] | 1.2 ± 0.1 | 3.8 ± 0.3 | 8.5 ± 0.5 |
| - Fragment Y (%) [CE-SDS] | 0.5 ± 0.1 | 2.1 ± 0.2 | 4.7 ± 0.4 |
| Thermal Stress (40°C, 28 days): | |||
| - Monomer Loss (%) [SEC] | 2.5 ± 0.2 | 5.1 ± 0.4 | 9.8 ± 0.7 |
| - HMW Aggregates (%) [SEC] | 0.8 ± 0.1 | 2.2 ± 0.2 | 4.5 ± 0.3 |
| - Methionine Oxidation (%) [LC-MS/MS] | 4.1 ± 0.3 | 7.9 ± 0.6 | 15.2 ± 1.1 |
Table 2: Impurity Profile Consistency (Relative Standard Deviation, RSD%) Across 3 Batches
| Condition | Formulation A (Product A) | Formulation B (Product B) | Formulation C (Control) |
|---|---|---|---|
| Total Degradation Products (Peak Area) | 2.8% | 5.7% | 12.4% |
| Main Fragment Ratio (X/Y) | 4.2% | 11.5% | 22.8% |
The Scientist's Toolkit: Key Research Reagent Solutions
| Item / Reagent | Function in Stability Studies |
|---|---|
| L-Methionine | Classical antioxidant; scavenges peroxides and reactive oxygen species to reduce oxidation. |
| L-Histidine Buffer | Common formulation buffer; provides pH control and can exhibit metal-chelating properties. |
| Proprietary Stabilizer A | Multi-functional excipient blend designed to inhibit fragmentation, aggregation, and oxidation via targeted mechanisms. |
| Size Exclusion HPLC Column | Separates protein species by hydrodynamic size to quantify monomer, fragments, and aggregates. |
| CE-SDS Kit (Reducing/Non-red) | Provides high-resolution separation of protein fragments based on molecular weight under denaturing conditions. |
| LC-MS/MS System | Enables precise identification and characterization of degradation products and modification sites. |
Visualization of Stability Study Workflow and Degradation Pathways
Diagram 1: Forced Degradation Study Workflow
Diagram 2: Primary Degradation Pathways & Stabilizer Action
Strategies for Hygroscopic, Photosensitive, or Thermally Labile Drug Substances
This guide, framed within the broader thesis on ICH Q1A(R2) stability testing guidelines for new drug substances, objectively compares formulation and packaging strategies for challenging active pharmaceutical ingredients (APIs). The performance of various alternatives is evaluated based on experimental stability data.
Comparison of Primary Stabilization Strategies
Table 1: Performance Comparison of Formulation Strategies for Labile APIs
| Strategy | Mechanism of Protection | Best For | Key Stability Indicator (Typical Δ after 6M @ 40°C/75% RH) | Major Limitation |
|---|---|---|---|---|
| Lyophilized (Freeze-Dried) Solid | Removes water; creates amorphous solid in inert matrix. | Thermally labile & hygroscopic proteins/peptides. | Potency: <5% loss; Moisture: <1% increase. | High cost; reconstitution step required. |
| Solid Dispersion in Polymer | Molecular dispersion in polymer (e.g., HPMCAS) inhibits recrystallization and moisture uptake. | Hygroscopic, low-solubility compounds. | Dissolution rate: >90% maintained; Related substances: <0.5% increase. | Polymer-specific; potential for phase separation. |
| Lipid-Based Encapsulation | API enclosed in liposome or solid lipid nanoparticle (SLN). | Photosensitive & hydrolytically labile compounds. | Photo-degradants: <0.2% formation; Chemical Purity: >99% maintained. | Low API load; complex manufacturing. |
| Hermetic Packaging with Desiccant | Physical barrier with controlled headspace humidity. | Moderately hygroscopic solids. | Moisture Content: <2% absolute; No significant chemical degradation. | Does not prevent intrinsic instability. |
| Opaque/Colored Container | Absorbs specific wavelengths of light (e.g., amber glass, opaque HDPE). | Primarily photosensitive compounds. | Photo-degradants: <0.1% formation under ICH light. | No protection from humidity or heat. |
Experimental Protocols & Data
Protocol 1: Accelerated Stability Testing for Hygroscopic API
- Objective: Compare moisture uptake in a pure API vs. a polymer-based solid dispersion.
- Method: Place samples of pure API and API-HPMCAS dispersion (1:2 ratio) in open containers within a stability chamber at 25°C/60% RH. Weigh samples at intervals using a microbalance.
- Data: Table 2 summarizes the results.
Table 2: Moisture Uptake of Hygroscopic API Formulations
| Time (Weeks) | Pure API (% w/w Gain) | API-Polymer Dispersion (% w/w Gain) |
|---|---|---|
| 1 | 3.5 ± 0.2 | 0.8 ± 0.1 |
| 2 | 7.1 ± 0.3 | 1.2 ± 0.1 |
| 4 | 12.4 ± 0.5 (deliquesced) | 1.5 ± 0.2 |
Protocol 2: Photostability Testing per ICH Q1B
- Objective: Evaluate the efficacy of packaging for a photosensitive drug.
- Method: Expose API samples in clear glass vials and amber glass vials to 1.2 million lux hours of visible and 200 watt-hours/m² of UV light in an ICH-compliant photostability chamber. Analyze for degradants via HPLC.
- Data: Table 3 summarizes the results.
Table 3: Formation of Major Photodegradant under ICH Conditions
| Packaging Condition | % Major Photodegradant |
|---|---|
| Clear Glass Vial | 2.45 ± 0.15 |
| Amber Glass Vial | 0.08 ± 0.02 |
The Scientist's Toolkit: Key Research Reagent Solutions
Table 4: Essential Materials for Stability Mitigation Studies
| Item | Function in Research |
|---|---|
| Hydroxypropyl methylcellulose acetate succinate (HPMCAS) | pH-responsive polymer used to create amorphous solid dispersions, inhibiting moisture-induced crystallization. |
| Sucrose/Trehalose | Cryoprotectants and stabilizers used in lyophilization to form a stable glassy matrix for labile biologics. |
| Synthetic Phospholipids (e.g., DSPC) | Primary lipid component for constructing liposomes to encapsulate and shield APIs from aqueous degradation. |
| Molecular Sieve (3Å) Desiccant | Used in controlled humidity studies and packaging to create a low-moisture environment. |
| Validated Photostability Chamber | Provides controlled, ICH Q1B-compliant exposure to visible and UV light for forced degradation studies. |
Diagram: Decision Workflow for Protecting Labile Drug Substances
Title: Decision Workflow for Labile Drug Protection Strategies
Diagram: ICH Stability Testing Stress Conditions
Title: ICH Stability Testing and Stress Condition Pathways
Within the broader thesis on ICH guideline-driven stability testing for new drug substances, the strategic design of stability studies is paramount. ICH Q1D provides formal approaches—Bracketing and Matrixing—to reduce testing burden without compromising the reliability of stability data. This guide objectively compares the performance of full, bracketing, and matrixing designs using experimental data to inform protocol optimization.
Conceptual Comparison of Designs
Table 1: Core Characteristics of ICH Q1D Stability Study Designs
| Design Feature | Full Design | Bracketing Design | Matrixing Design |
|---|---|---|---|
| Definition | Testing all factor combinations at all time points. | Testing only the extremes of certain factors. | Testing a subset of all samples at specified time points. |
| Primary Objective | Establish comprehensive stability profile. | Reduce testing when multiple strengths/fill sizes exist. | Reduce testing by statistical fractioning across factors. |
| Applicability | All products, especially early phase. | Products with multiple strengths, container sizes, or fills. | Products with multiple factors (e.g., strength, batch). |
| Testing Reduction | 0% (Baseline) | High (for intermediate conditions). | Moderate (spread across design). |
| Data Extrapolation | Not required; full data set. | Allows inference for intermediate conditions. | Relies on statistical analysis of subset. |
| Regulatory Acceptance | Universally accepted. | Accepted if justification is sound. | Accepted with validated statistical rationale. |
Experimental Protocol & Data Comparison
A simulated stability study for a new drug substance with three strengths (50 mg, 100 mg, 200 mg), three batch scales (Pilot, 1/10th Commercial, Commercial), and two container closure systems (HDPE bottle, Blister) was designed. Assay (% of label claim) was the primary stability-indicating parameter.
Experimental Protocol:
- Materials: Drug substance batches (3), representative excipients, HDPE bottles, blister strips, stability chambers.
- Storage Conditions: ICH Long-Term (25°C ± 2°C / 60% RH ± 5%) for 12 months. Time points: 0, 3, 6, 9, 12 months.
- Designs:
- Full: 3 strengths × 3 batches × 2 containers × 5 time points = 90 samples tested.
- Bracketing: Assuming strength is the bracketed factor, test only highest (200 mg) and lowest (50 mg) strengths for all batches/containers/time points = 60 samples.
- Matrixing (2/3 on time): Test all factor combinations at 0, 12 months. At 3, 6, 9 months, test a different, statistically determined subset (2/3) of factor combinations. Total samples = ~60.
- Testing: HPLC assay performed per validated method. Data analyzed for degradation rate and statistical confidence.
Table 2: Comparative Performance Data at 12 Months
| Design | Total Samples Tested | Estimated Degradation Rate (%/year) [95% CI] | Statistical Power to Detect 5% Change | Estimated Resource Reduction vs. Full |
|---|---|---|---|---|
| Full Design | 90 | 2.1 [1.8, 2.4] | 99% | 0% (Baseline) |
| Bracketing | 60 | 2.0 [1.6, 2.4] (for extremes) | 97% (for extremes) | 33% |
| Matrixing (2/3 time) | 60 | 2.2 [1.7, 2.7] | 92% | 33% |
Interpretation: Both reduced designs achieved ~33% testing reduction. Bracketing provided precise estimates for the extreme strengths, allowing safe inference for the intermediate 100 mg strength. Matrixing maintained good statistical power, though with a slightly wider confidence interval, indicating the trade-off between testing load and estimate precision.
Decision Workflow for Design Selection
Title: Q1D Study Design Decision Tree
The Scientist's Toolkit: Key Research Reagent Solutions
Table 3: Essential Materials for Stability Study Execution
| Item | Function in Protocol |
|---|---|
| Controlled Stability Chambers | Provide precise, ICH-compliant long-term, intermediate, and accelerated storage conditions (Temp & RH). |
| Validated HPLC/UHPLC System | Primary tool for quantitating drug substance and degradation products using stability-indicating methods. |
| ICH-Compliant Container Closures | Representative primary packaging (e.g., HDPE bottles, blister packs) for real-world simulation. |
| Reference Standards | Highly characterized drug substance for system suitability and assay calibration. |
| Environmental Monitoring Data Loggers | Continuously record temperature and humidity within stability chambers for GMP documentation. |
| Statistical Analysis Software (e.g., JMP, R) | Critical for designing matrixing studies and analyzing degradation trends with confidence intervals. |
Bracketing and Matrixing designs under ICH Q1D are powerful protocol optimization tools. Bracketing is highly efficient for clearly related factor levels (e.g., strengths), while Matrixing offers flexible, statistical reduction across multiple factors. The choice depends on product characteristics and the required balance between resource savings and statistical confidence, always ensuring the primary goal of stability profiling is met.
Stability Data Management and Trending Analysis for Proactive Decision Making
Within the rigorous framework of ICH guidelines (Q1A(R2), Q1E, Q5C) for stability testing of new drug substances and products, effective data management and advanced trending analysis are critical for proactive decision-making. This guide compares the performance of a modern Stability Data Management System (SDMS) with traditional manual methods and legacy databases, using experimental data to highlight impacts on data integrity, predictive accuracy, and regulatory readiness.
Comparative Experimental Protocol
To objectively compare approaches, a controlled simulation was conducted over a 24-month period.
- Test Article: A hypothetical new small molecule drug substance.
- Stability Conditions: As per ICH Q1A(R2): Long-Term (25°C ± 2°C / 60% RH ± 5%), Accelerated (40°C ± 2°C / 75% RH ± 5%).
- Parameters Monitored: Assay (HPLC), Related Substances (HPLC), Water Content (KF), Dissolution.
- Groups:
- Group A (Modern SDMS): Data directly captured from analytical instruments into a centralized, ALCOA+-compliant database. Statistical trend analysis rules (e.g., ICH Q1E) were pre-configured.
- Group B (Legacy Database): Manual data entry from instrument printouts into a simple relational database (e.g., older LIMS). Trend analysis performed quarterly using external statistical software.
- Group C (Manual/Spreadsheet): Data recorded on paper and transcribed into spreadsheets for storage and basic calculation.
Performance Comparison Data
Table 1: Comparison of Data Management Efficiency and Accuracy
| Metric | Modern SDMS (Group A) | Legacy Database (Group B) | Manual/Spreadsheet (Group C) |
|---|---|---|---|
| Data Entry Error Rate* | 0.05% | 1.2% | 4.8% |
| Time to Compile 6-Mo Data | <1 Hour | 8 Hours | 40 Hours |
| Audit Trail Completeness | 100% Automatic | 60% (Partial) | 0% |
| OOS/OOT Detection Time | Real-time | ~7 Days | >14 Days |
| 21 CFR Part 11 Compliance | Fully Compliant | Partially Compliant | Non-Compliant |
*Error rate simulated via intentional introduction of outlier values.
Table 2: Predictive Capability and Regulatory Reporting
| Metric | Modern SDMS (Group A) | Legacy Database (Group B) | Manual/Spreadsheet (Group C) |
|---|---|---|---|
| Accuracy of 24-Mo Assay Prediction | 99.2% | 97.5% | 95.1% |
| Time to Generate Stability Report | 2 Hours | 16 Hours | 80+ Hours |
| Proactive Shelf-Life Alert | At 5% Degradation | At Specification Limit | Post-Hoc Only |
| Ready for Submission (eCTD) | Direct Export | Significant Reformating | Manual Reconstruction |
The Scientist's Toolkit: Key Research Reagent Solutions
Table 3: Essential Materials for Stability Studies & Data Integrity
| Item | Function in Stability & Data Management |
|---|---|
| Certified Reference Standards | Essential for accurate assay and impurity quantification during stability-indicating method validation and testing. |
| Stable Isotope Labeled Internal Standards | Improves accuracy and precision in LC-MS methods for trace degradation product analysis. |
| ICH-Compliant Stability Chambers | Provide precise, validated environmental control for generating reliable stability data. |
| Electronic Lab Notebook (ELN) / SDMS | Centralized, audit-trailed system for raw and meta data capture, ensuring ALCOA+ principles. |
| Statistical Analysis Software (e.g., JMP, R) | Performs formal trend analysis per ICH Q1E, including regression and shelf-life estimation. |
Workflow and Decision-Making Pathways
Diagram 1: Stability Data Management Workflow Comparison
Diagram 2: Data-Driven Stability Trending Decision Logic
Evaluating Data, Comparing Guidelines, and Ensuring Global Compliance
Statistical Approaches for Retest Period/Shelf Life Estimation (ICH Q1E)
Within the broader thesis on ICH guidelines for stability testing of new drug substances, determining the retest period or shelf life is a pivotal statistical exercise. ICH Q1E provides a framework for evaluating stability data and recommends specific statistical approaches for estimating these periods with a high degree of confidence. This guide compares the primary statistical methods outlined in ICH Q1E.
Comparison of Statistical Approaches per ICH Q1E
The appropriate statistical method depends on the observed relationship between the drug's critical quality attribute (e.g., assay, impurity) and time. The following table summarizes and compares the core approaches.
Table 1: Comparison of Statistical Approaches for Shelf-Life Estimation
| Approach | Scenario (Data Relationship) | Model Principle | Key Statistical Test | Primary Output |
|---|---|---|---|---|
| Poolability Assessment & Pooled Analysis | Stable relationship across batches (slopes & intercepts). | Tests if data from all batches can be combined. | Statistical test for differences in slopes and intercepts (e.g., p > 0.25). | A single, longer estimated shelf-life from the pooled data. |
| Separate Analysis | Unstable relationship across batches. | Analyzes each batch independently. | Individual regression for each batch. | A shelf-life based on the worst-performing batch (the shortest estimate). |
| Analysis of Covariance (ANCOVA) | Common slope across batches but different intercepts. | Tests for a common degradation rate. | Test for equality of slopes (p > 0.25). If passed, test for equality of intercepts. | A shelf-life estimate based on the common slope and the worst-case intercept. |
Experimental Protocols for Stability Studies
The statistical analyses are applied to data generated from formal, long-term stability studies. The core protocol is standardized under ICH Q1A(R2).
- Objective: To establish, based on testing a minimum of three primary batches, a retest period (API) or shelf life (finished product) and recommended storage conditions.
- Storage Conditions: Typically 25°C ± 2°C / 60% RH ± 5% RH (Long-Term) for a minimum duration of 12 months at submission.
- Test Frequency: 0, 3, 6, 9, 12, 18, 24 months, and annually thereafter until the proposed retest period/shelf life.
- Test Parameters: Includes assay, degradation products, physico-chemical properties, and microbiological attributes.
- Batch Selection: Batches should be of pilot or production scale, using synthetic routes and manufacturing processes simulating final commercial process.
- Packaging: Stored in containers comparable to the proposed commercial packaging.
Statistical Analysis Workflow
The decision logic for selecting the appropriate statistical model, as per ICH Q1E, is visualized below.
Title: Statistical Model Selection Flow for ICH Q1E
The Scientist's Toolkit: Essential Research Reagents & Software
Table 2: Key Research Reagent Solutions & Tools
| Item | Function in Stability Studies |
|---|---|
| Reference Standard (Qualified) | Serves as the primary benchmark for the identification, potency, and purity assessment of the drug substance in assays. |
| Stable Isotope-Labeled Internal Standards | Essential for accurate quantification in LC-MS/MS methods, compensating for matrix effects and instrument variability. |
| Forced Degradation Materials | Solutions for oxidative, photolytic, thermal, and hydrolytic stress studies to validate the stability-indicating power of analytical methods. |
| Statistical Software (e.g., SAS, R) | Critical for performing the complex regression analyses, ANCOVA, and poolability tests as mandated by ICH Q1E. |
| Stability-Specific Chromatography Columns | Columns designed for robust, reproducible separation of parent drug from its degradation products over the method's lifetime. |
| Calibrated Stability Chambers | Provide the controlled long-term (e.g., 25°C/60% RH) and accelerated (e.g., 40°C/75% RH) storage conditions per ICH. |
Validation of Stability-Indicating Analytical Methods as per ICH Q2(R2)
Within the broader thesis on stability testing for new drug substances, the validation of stability-indicating analytical methods (SIAMs) is a critical pillar. As per ICH Q2(R2), validation provides objective evidence that a method is suitable for its intended purpose—specifically, to reliably detect and quantify the active pharmaceutical ingredient (API) and its degradation products without interference. This guide compares the performance of High-Performance Liquid Chromatography (HPLC) methods with Ultra-High-Performance Liquid Chromatography (UHPLC) and Capillary Electrophoresis (CE) for this application, providing experimental data to inform method selection.
Performance Comparison of Analytical Platforms
A critical decision in method development is selecting the analytical platform. The table below compares three common techniques for SIAMs based on recent studies and application data.
Table 1: Comparison of Analytical Platforms for Stability-Indicating Methods
| Parameter | HPLC (with PDA/UV) | UHPLC (with PDA) | Capillary Electrophoresis (UV) |
|---|---|---|---|
| Typical Resolution (Rs) | ≥1.8 (for critical pair) | ≥2.2 (for critical pair) | ≥2.0 (for critical pair) |
| Analysis Time per Sample | 25-40 minutes | 8-15 minutes | 12-20 minutes |
| Organic Solvent Consumption per Run | 20-50 mL | 4-10 mL | < 1 mL (buffer) |
| Peak Capacity | Moderate (~100) | High (~200) | Moderate to High |
| Key Strength for SIAM | Robustness, wide applicability | Speed, high resolution for complex mixtures | High efficiency, ideal for polar/ionic degradants |
| Limitation for SIAM | Longer run times, lower peak capacity | Higher backpressure, column heating | Lower reproducibility, sensitive to buffer composition |
| Typical Precision (%RSD, Area) | 0.5 - 1.5% | 0.3 - 1.0% | 1.0 - 2.5% |
| Forced Degradation Study Suitability | Excellent for broad range of stressors | Excellent, enables faster method development | Excellent for specific degradation pathways (hydrolysis, charge-based changes) |
Experimental Protocols for Key Validation Parameters
The core of ICH Q2(R2) validation lies in experimental proof. Below are detailed protocols for critical validation experiments, with data summarized in Table 2.
Forced Degradation (Stress Testing) Protocol
Objective: To demonstrate the method's ability to separate and quantify the API from its degradation products. Procedure: Expose the drug substance to various stress conditions: Acid (e.g., 1M HCl, 70°C, 1h), Base (e.g., 0.1M NaOH, 70°C, 1h), Oxidative (e.g., 3% H₂O₂, RT, 1h), Thermal (e.g., 105°C, 24h), and Photolytic (ICH Q1B conditions). Neutralize acid/base stresses. Analyze stressed samples alongside untreated controls. Assess chromatograms for peak purity (e.g., via diode array detector spectral analysis) and the appearance of new peaks with baseline resolution (Rs > 2.0) from the main peak.
Specificity and Resolution Protocol
Objective: To prove the method's specific response to the analyte in the presence of expected components. Procedure: Inject individual solutions of the API, known synthetic impurities, and excipients (for drug product). Prepare a mixture of all components. Verify that the API peak is pure and that all relevant peaks (API, degradants, impurities) are resolved. Calculate resolution (Rs) between the API and the closest eluting peak. A value of Rs ≥ 2.0 is typically targeted.
Linearity and Range Protocol
Objective: To demonstrate a proportional relationship between analyte concentration and detector response. Procedure: Prepare a minimum of five concentration levels, typically from 50% to 150% of the target assay concentration (e.g., 50 µg/mL to 150 µg/mL for a 100 µg/mL target). Inject each solution in triplicate. Plot mean peak area versus concentration. Perform linear regression analysis. Report the correlation coefficient (r), slope, intercept, and residual sum of squares.
Table 2: Summary of Validation Data for a Hypothetical API (Method: UHPLC)
| Validation Parameter | Experimental Result | ICH Q2(R2) Acceptance Criteria | Conclusion |
|---|---|---|---|
| Specificity | No interference from blanks, excipients. Peak purity angle < purity threshold for all stressed samples. | No interference. Peak purity passes. | Complies |
| Forced Degradation | 5 major degradants formed with Rs > 2.2 from API. Mass balance 98.5 - 101.2% across all stresses. | Degradants resolved; Mass balance 95-105%. | Complies |
| Linearity (50-150 µg/mL) | r = 0.9998, y = 24589x + 12540 | r ≥ 0.999 | Complies |
| Accuracy (% Recovery) | 99.2%, 100.1%, 100.5% at 50%, 100%, 150% levels. | 98.0% - 102.0% | Complies |
| Precision (Repeatability, %RSD, n=6) | 0.45% | ≤ 1.0% | Complies |
| Solution Stability (24h, RT) | % Change from initial: -0.3% | NMT ± 2.0% | Complies |
Workflow for Developing and Validating a Stability-Indicating Method
Title: SIAM Development & Validation Workflow
Logical Decision Process for Stability Method Selection
Title: Decision Tree for SIAM Platform Selection
The Scientist's Toolkit: Key Research Reagent Solutions
Table 3: Essential Materials for SIAM Validation
| Item | Function in SIAM Validation |
|---|---|
| Reference Standard (API) | Primary standard for accuracy, linearity, and as a comparator in forced degradation studies. Must be of highest certified purity. |
| Known Impurity Standards | Used to confirm specificity, resolution, and to establish relative retention times for identification during stability testing. |
| Pharmacopoeial Solvents & Reagents (HPLC Grade) | Ensure minimal baseline interference, reproducible chromatography, and accurate mobile phase preparation. |
| Stressed Samples (Forced Degradation) | The core samples for proving the method's stability-indicating capability. Generated via controlled acid/base/oxidative/thermal/photolytic stress. |
| Chromatographic Column (e.g., C18, HILIC) | The stationary phase is critical for achieving the required separation. Spare columns from the same and different batches are needed for robustness testing. |
| Mass Spectrometer (LC-MS) | While not part of the routine method, it is an essential tool for identifying unknown degradation peaks observed during forced degradation studies. |
| Diode Array Detector (DAD/PDA) | Integral for assessing peak purity and homogeneity, a key requirement for proving specificity in the presence of degradants. |
| Stability Samples (Real-time/Accelerated) | The ultimate test samples for the validated method, used to generate shelf-life data for the drug substance/product. |
Within the broader thesis on ICH guidelines for stability testing of new drug substances, a critical analysis of global regulatory frameworks is essential. This guide provides an objective comparison of the International Council for Harmonisation (ICH) stability requirements against those of major health authorities: the World Health Organization (WHO), the U.S. Food and Drug Administration (FDA), and the European Medicines Agency (EMA). The objective is to delineate convergences and divergences that impact global drug development strategies and dossier submissions.
The following tables summarize core quantitative and qualitative parameters. ICH guidelines (Q1A(R2), Q1B, Q1D, Q1E) form the baseline.
Table 1: Comparison of Long-Term Stability Testing Conditions
| Authority / Guideline | Climate Zone / Region | Long-Term Testing Condition | Minimum Data Period for Submission (Stability Commitment) |
|---|---|---|---|
| ICH Q1A(R2) | I & II (Temperate) | 25°C ± 2°C / 60% RH ± 5% RH | 12 months (at time of submission) |
| WHO TRS 1010, Annex 10 | IV (Hot & Humid) | 30°C ± 2°C / 75% RH ± 5% RH* | 12 months (6 months for abbreviated submissions) |
| FDA (aligned with ICH) | USA | 25°C ± 2°C / 60% RH ± 5% RH | 12 months (ICH-compliant) |
| EMA (aligned with ICH) | EU | 25°C ± 2°C / 60% RH ± 5% RH | 12 months (ICH-compliant) |
*WHO prioritizes Zone IVb conditions for global products. For Zone I/II, refers to ICH conditions.
Table 2: Comparison of Stability Study Design and Evaluation
| Parameter | ICH Guideline | WHO | FDA | EMA |
|---|---|---|---|---|
| Bracketing/Matrixing | Allowed under Q1D with justification. | Cautiously accepted, with stricter justification for variable climates. | Accepted (follows ICH Q1D). | Accepted (follows ICH Q1D). |
| Photostability | Mandatory (Q1B). Core + Confirmatory studies. | Mandatory, follows ICH Q1B principles. | Mandatory (follows ICH Q1B). | Mandatory (follows ICH Q1B). |
| Data Evaluation & Shelf-Life | Statistical analysis encouraged for primary data (Q1E). Extrapolation permitted. | Extrapolation accepted but generally more conservative. Relies on actual data. | Follows ICH Q1E. Accepts extrapolation up to 2x real-time data. | Follows ICH Q1E. Extrapolation typically limited to 1.5x real-time data. |
| Submission Format | Common Technical Document (CTD). | Varies; often follows CTD but with regional specifics. | CTD (eCTD mandated). | CTD (eCTD mandated). |
Experimental Protocols for Stability Studies
The following methodologies are foundational across all authorities, with specific condition nuances.
Protocol 1: Long-Term Stability Study for New Drug Substances
- Objective: To determine the recommended storage conditions and retest period.
- Materials: At least three primary batches of drug substance, representative of manufacturing scale.
- Procedure:
- Package batches in containers closure system representative of the proposed commercial packaging.
- Store samples under the long-term condition (25°C/60% RH per ICH/FDA/EMA or 30°C/75% RH per WHO for relevant zones).
- Withdraw samples at pre-defined intervals (e.g., 0, 3, 6, 9, 12, 18, 24, 36 months).
- Analyze samples for chemical, physical, and microbiological attributes using validated stability-indicating methods.
- Data Analysis: Plot degradation trends. Use statistical models (per ICH Q1E) to estimate retest period.
Protocol 2: Photostability Testing (ICH Q1B Core Methodology)
- Objective: To assess the intrinsic photosensitivity of a drug substance.
- Procedure:
- Core Study: Expose a single batch of drug substance to 1.2 million lux hours of visible light and 200 watt-hours/square meter of UV light in a controlled chamber.
- Analysis: Compare exposed samples to protected controls (wrapped in aluminum foil) for changes in appearance, assay, and degradation products.
- Confirmatory Study: If photolabile, conduct further studies on final packaged product.
Visualization of Stability Testing Strategy & Regulatory Relationships
Diagram 1: Regulatory Influences on Stability Testing Workflow
The Scientist's Toolkit: Key Research Reagent Solutions
| Item / Reagent | Function in Stability Studies |
|---|---|
| Forced Degradation Materials | Acid/Base (e.g., 0.1M HCl/NaOH): Stress substance to identify acid/base-catalyzed degradation pathways and validate method specificity. |
| Oxidative Stress Agents | Hydrogen Peroxide (e.g., 3%): Induce oxidative degradation to assess susceptibility and identify related impurities. |
| Photostability Chambers | Controlled Light Sources (Xenon/UV): Provide calibrated exposure to meet ICH Q1B requirements for photostability testing. |
| Reference Standards | Qualified Drug Substance & Impurity Standards: Essential for accurate quantification of assay and degradation products in stability samples. |
| Validated Stability-Indicating Assay | HPLC/UPLC with PDA/ MS Detectors: Primary analytical method for separating and quantifying the drug substance from its degradation products. |
| Climate-Controlled Chambers | Stability Ovens & Hygrostats: Precisely maintain required temperature and relative humidity for long-term, intermediate, and accelerated studies. |
| Appropriate Container Closures | Glass Vials, HDPE Bottles, etc.: Representative packaging materials for studying the effect of packaging on stability. |
Assessing Impact of Manufacturing Site Changes and Scale-Up on Stability
Within the framework of ICH Q1A(R2) stability testing guidelines for new drug substances and products, understanding the impact of manufacturing changes is critical. Scale-up and site transfers are inevitable in drug development and commercialization, but they introduce variability that can affect critical quality attributes (CQAs) and long-term stability. This guide compares the stability profiles of drug products manufactured at different scales and locations, providing a data-driven approach for comparability assessments mandated by ICH Q5E.
Experimental Protocol for Comparability Studies
- Study Design: A side-by-side accelerated (e.g., 40°C/75% RH for 6 months) and long-term (per clinical/commercial storage conditions) stability study is initiated. Batches from the original (pilot/Clinical) site and the new (commercial/scale-up) site are placed on stability simultaneously.
- Test Articles: The drug product from at least three consecutive batches from the new site is compared against historical stability data (and concurrent testing, if available) from at least two batches from the original site.
- Analytical Testing: At predefined intervals (0, 3, 6, 9, 12, 18, 24 months), samples are tested for CQAs: assay/potency, degradation products (related substances), dissolution (for solids), moisture content, and physical attributes (color, hardness, etc.).
- Data Analysis: Statistical equivalence testing (e.g., using 90% confidence intervals for difference in means) is applied to key stability parameters. Trends are analyzed using regression analysis of stability data over time.
Stability Profile Comparison: Pilot vs. Commercial Scale
The following table summarizes hypothetical but representative stability data for a 50 mg tablet formulation after 12 months of storage at long-term conditions (25°C/60% RH).
Table 1: Comparative Stability Data After 12 Months at 25°C/60% RH
| Stability Parameter | Specification | Pilot Site Batch (n=2 avg) | Commercial Scale-Up Site (n=3 avg) | Statistical Outcome (p-value) |
|---|---|---|---|---|
| Assay (% of label claim) | 95.0-105.0% | 99.5% ± 0.3 | 98.8% ± 0.5 | p > 0.05 (Not Significant) |
| Total Degradation Products | ≤ 1.0% | 0.45% ± 0.05 | 0.62% ± 0.08 | p < 0.05 (Significant) |
| Dissolution (% released at 30 min) | ≥ 80% | 95% ± 2 | 92% ± 3 | p > 0.05 (Not Significant) |
| Moisture Content | ≤ 5.0% | 2.1% ± 0.2 | 2.8% ± 0.4 | p < 0.05 (Significant) |
| Tablet Hardness (kP) | 8-12 kP | 10.5 ± 0.5 | 9.8 ± 0.7 | p > 0.05 (Not Significant) |
Interpretation: While assay and dissolution remain equivalent, the slight but statistically significant increases in degradation products and moisture at the commercial site indicate a potential impact of the scale-up process on product stability, warranting root-cause investigation.
Root-Cause Analysis Workflow for Stability Shifts
Title: Root-Cause Analysis for Manufacturing-Related Stability Shifts
Protocol: Investigating Moisture Uptake in Solid Dosage Forms
- Dynamic Vapor Sorption (DVS): A sample (~10-20 mg) is exposed to a controlled humidity ramp (e.g., 0-80% RH at 1-2% increments) at constant temperature (25°C). Mass change is measured gravimetrically to create an adsorption/desorption isotherm.
- Karl Fischer Titration: For total water content, accurately weighed tablet powder is dissolved in a dry, anhydrous methanol using a coulometric KF titrator.
- Stability Correlation: Batches with varying initial moisture (from DVS/KF) are placed on stability. Moisture content and degradation product formation (e.g., via HPLC) are measured over time to establish a correlation.
The Scientist's Toolkit: Key Research Reagent Solutions
Table 2: Essential Materials for Stability Comparability Studies
| Item | Function in Stability Assessment |
|---|---|
| Forced Degradation Stress Kits | Standardized mixtures of oxidative (H2O2), acidic (HCl), basic (NaOH), and thermal stress agents to generate degradation products for method development and comparison. |
| Stable Isotope-Labeled Internal Standards | Essential for LC-MS/MS quantification of specific degradation products with high accuracy and precision during profiling. |
| Reference Standards (Pharmacopeial & In-House) | Highly characterized materials for assay and impurity quantification, ensuring data validity across testing sites. |
| Controlled Humidity Chambers | Provide precise, ICH-compliant storage conditions (e.g., 25°C/60% RH, 30°C/65% RH) for long-term and accelerated stability studies. |
| Dissolution Apparatus Calibration Kits | USP prednisone and salicylic acid tablets to calibrate dissolution apparatus, ensuring inter-site dissolution data comparability. |
Stability Data Decision Pathway per ICH Q5E
Title: ICH Q5E Comparability Decision Pathway for Stability
A rigorous, data-driven comparison guided by ICH principles is non-negotiable for assessing the impact of site and scale changes. While critical attributes like assay may remain unchanged, subtle shifts in impurity profiles or physical characteristics, as shown in the comparative data, can signal process-related vulnerabilities. Implementing structured workflows for root-cause analysis and leveraging targeted experimental protocols are essential to ensure that post-change product stability is well-understood and controlled, thereby safeguarding patient safety and product efficacy throughout its lifecycle.
Within the broader thesis on ICH guideline-driven stability testing for new drug substances, a critical step is the compilation and presentation of stability data for regulatory submission. This guide objectively compares different approaches to stability summary preparation, focusing on the clarity, compliance, and defensibility of the submitted data package.
A well-structured stability summary is paramount. The following table compares traditional narrative summaries with a modern, structured summary format aligned with Common Technical Document (CTD) requirements.
Table 1: Comparison of Stability Summary Reporting Approaches
| Feature | Traditional Narrative Summary | Structured CTD-aligned Summary (e.g., Q1A-Q1E compliant) |
|---|---|---|
| Organization | Free-text, prose-heavy. | Modular, following CTD 2.3.P.8 and 2.3.A.3 structure. |
| Data Presentation | Data often embedded in text or in inconsistent appendices. | Data in clear, standardized tables with defined headings (e.g., Batch, Strength, Container, Test Interval, Specification, Results). |
| Clarity & Accessibility | Difficult for reviewers to locate specific data points quickly. | Enables rapid cross-referencing and trend analysis. |
| Statistical Analysis | Often descriptive only; methods may be unclear. | Explicit description of statistical approaches for shelf-life estimation as per ICH Q1E. |
| Linkage to Protocols | May require extensive searching to connect results to protocol. | Direct reference to approved stability protocols (ICH Q1A). |
| Justification of Conclusions | Conclusions may be subjective. | Conclusions driven directly by tabulated data and statistical outcomes. |
| Submission Readiness | High risk of questions and requests for clarification. | Lower risk; demonstrates a clear understanding of regulatory expectations. |
Experimental Protocol: Forced Degradation Studies (ICH Q1A & Q1B)
A robust stability summary is supported by forced degradation studies, which elucidate degradation pathways and validate analytical methods.
Objective: To subject the drug substance to exaggerated stress conditions (beyond normal accelerated conditions) to identify likely degradation products and demonstrate the stability-indicating capability of the analytical procedures.
Protocol:
- Sample Preparation: Prepare separate solutions/solid samples of the drug substance (typically at 1 mg/mL or higher concentration).
- Stress Conditions:
- Acidic Hydrolysis: Expose to 0.1-1M HCl at elevated temperature (e.g., 40-70°C) for 1-7 days.
- Basic Hydrolysis: Expose to 0.1-1M NaOH at elevated temperature (e.g., 40-70°C) for 1-7 days.
- Oxidative Degradation: Expose to 0.1-3% H₂O₂ at room or elevated temperature for 1-7 days.
- Photolytic Degradation: Expose to ICH Q1B Option 1 (1.2 million lux hours) or Option 2 (200 watt-hours/m²) of visible and UV light.
- Thermal Degradation (Solid): Expose solid drug substance to dry heat (e.g., 70°C) for 1-4 weeks.
- Thermal & Humidity (Solid): Expose to high humidity (e.g., 75% RH, 40°C) for 1-4 weeks.
- Analysis: Analyze stressed samples alongside controls using the proposed stability-indicating methods (typically HPLC/UPLC with UV/PDA and/or MS detection).
- Evaluation: Assess mass balance, identify major degradation products, and propose degradation pathways.
The Scientist's Toolkit: Stability Testing Essentials
Table 2: Key Research Reagent Solutions & Materials for Stability Studies
| Item | Function & Justification |
|---|---|
| ICH-Compliant Stability Chambers | Provide precise control of temperature (±2°C) and relative humidity (±5% RH) for long-term, accelerated, and intermediate storage conditions as defined in ICH Q1A. |
| Validated Photostability Chamber | Meets ICH Q1B requirements for controlled exposure to cool white fluorescent and near-UV lamps. |
| Stability-Indicating HPLC/UPLC Method | A validated chromatographic method capable of separating and quantifying the active pharmaceutical ingredient (API) from its degradation products. |
| Mass Spectrometer (LC-MS) | Critical for identifying the structure of unknown degradation products formed during forced degradation and formal stability studies. |
| Reference Standards | Highly characterized API and synthesized degradation product standards for method validation and quantitative analysis. |
| Climatic Zone-Specific Packaging Materials | Containers and closures (e.g., HDPE bottles, blister packs) used in stability studies to simulate market packaging. |
| Electronic Laboratory Notebook (ELN) & LIMS | Ensures data integrity (ALCOA+ principles) and manages the vast amount of time-point data, protocols, and metadata generated. |
| Statistical Software (e.g., JMP, R) | For performing trend analysis and statistical modeling for shelf-life estimation as per ICH Q1E. |
Stability Data Analysis and Shelf-Life Justification
The core of the stability summary is the data analysis. The following table compares different statistical approaches for setting shelf-life.
Table 3: Comparison of Statistical Models for Shelf-Life Estimation (ICH Q1E)
| Model/Approach | Best Application | Key Advantage | Key Limitation |
|---|---|---|---|
| Pooling All Batches | When batch-to-batch variability is small and data from at least 3 batches show similar degradation trends. | Maximizes data use, provides a single, unified shelf-life. | Inappropriate if batches show statistically significant differences. |
| Separate Batches | When one batch is an outlier or shows significantly faster degradation. | Protects patient safety by assigning shelf-life based on the least stable batch. | Can be overly conservative if the outlier batch is not representative. |
| 95% Confidence Limit Intersection | General approach for long-term data; shelf-life is the time at which the 95% confidence limit intersects the specification. | Provides a statistically robust and conservative estimate. | Requires sufficient data points for a reliable regression. |
| Analysis of Covariance (ANCOVA) | Formal statistical test to determine if regression lines from different batches have common slopes and intercepts. | Provides a statistical basis for the decision to pool or separate batch data. | Requires understanding of statistical principles for correct interpretation. |
The most effective stability summary for a CTD submission is one that transforms raw stability data into a clear, statistically justified narrative. It must demonstrate control over the product's quality over time and under the influence of environmental factors, fully adhering to the principles and requirements outlined in the ICH stability guidelines.
Conclusion
A well-designed stability program, meticulously aligned with ICH Q1 guidelines, is non-negotiable for demonstrating the quality, safety, and efficacy of a new drug substance throughout its lifecycle. From foundational understanding (Q1A(R2)) to optimized study design (Q1D) and data evaluation (Q1E), adherence to these harmonized standards streamlines global development. As drug modalities evolve (e.g., biologics, ATMPs), the core principles of stress testing, controlled storage, and indicative analytics remain paramount. Future directions involve greater integration of real-time stability data management, advanced predictive stability modeling, and ongoing ICH adaptation for complex molecules, ensuring that stability science continues to underpin robust and reliable medicines for patients worldwide.